Eureka!

This exclamation is most famously attributed to the ancient Greek scholar Archimedes who reportedly proclaimed “Eureka!” when he stepped into a bath and noticed that the water level rose.

Archimedies realised that the volume of water displaced must be equal to the volume of the part of his body he had submerged but this was not why he was allegedly so delighted: he had been trying to solve a problem posed by Hiero of Syracuse who needed to know the purity of gold in an irregular shaped votive crown.

Hiero suspected that his goldsmith was diluting the pure gold with silver and Archimedes  knew that the density of pure gold was different from a gold-silver alloy. His bathtime revalation told him that he could now measure the volume of the crown and with the weight he could calculate the density – without damaging the crown.

The story may or may not be true, but the message is important – new understanding often  appears in a “flash of insight” when a conscious experience unblocks an unconscious conflict. Reality provides the nudge.

Improvement means change, change means learning, and learning means new understanding.  So facilitating improvement boils down to us a series of reality nudges that change our understanding step-by-step.

The problem is that reality is messy and complicated and noisy. There are reality nudges coming at us from all directions and all the time – and to avoid being overwhelmed we filter most of them out – the ones we do not understand.  This unconscious habit of discounting the unknown creates the state of blissful ignorance but has the downside of preventing us from learning and therefore preventing us from improving.

Occasionally a REALLY BIG REALITY NUDGE comes along and we are forced to take notice – this is called a smack – and it is painful and has the downside of creating an angry backlash.

The famous scientist Louis Pasteur is reported to have said “Chance favours the prepared mind” which means that when conditions are right (the prepared mind) a small, random nudge (chance) can trigger a Eureka effect.  What he is saying is that to rely on chance to improve we must prepare the context first.

The way of doing this is called structured reality – deliberately creating a context so the reality nudge has maximum effect.  So to learn and improve and at the same time avoid painful smacks we need to structure the reality so that small nudges are effective – and that is done using carefully designed reality immersion experiences.

The effect is remarkable – it is called the Eureka effect – and it is a repeatable and predictable phenomenon.

This is how the skills of Improvement Science are spread. Facilitators do not do it by delivering a lecture; or by distributing the theory in papers and books; or by demonstrating their results as case studies; or by dictating the actions of others.  Instead they create the context for learning and, if reality does not oblige, at just the right time and place they apply the nudge and …. Eureka!

The critical-to-success factor is creating the context – and that requires an effective design – it cannot be left to chance. 

Pushmepullyu

The pushmepullyu is a fictional animal immortalised in the 1960’s film Dr Dolittle featuring Rex Harrison who learned from a parrot how to talk to animals.  The pushmepullyu was a rare, mysterious animal that was never captured and displayed in zoos. It had a sharp-horned head at both ends and while one head slept the other stayed awake so it was impossible to sneak up on and capture.

The spirit of the pushmepullyu lives on in Improvement Science as Push-Pull and remains equally mysterious and difficult to understand and explain. It is confusing terminology. So what does Push-Pull acually mean?

To decode the terminology we need to first understand a critical metric of any process – the constraint cycle time (CCT) – and to do that we need to define what the terms constraint and cycle time mean.

Consider a process that comprises a series of steps that must be completed in sequence.  If we put one task through the process we can measure how long each step takes to complete its contribution to the whole task.  This is the touch time of the step and if the resource is immediately available to start the next task this is also the cycle time of the step.

If we now start two tasks at the same time then we will observe when an upstream step has a longer cycle time than the next step downstream because it will shadow the downstream step. In contrast, if the upstream step has a shorter cycle time than the next step down stream then it will expose the downstream step. The differences in the cycle times of the steps will determine the behaviour of the process.

Confused? Probably.  The description above is correct BUT hard to understand because we learn better from reality than from rhetoric; and we find pictures work better than words.  Pragmatic comes before academic; reality before theory.  We need a realistic example to learn from.

Suppose we have a process that we are told has three steps in sequence, and when one task is put through it takes 30 mins to complete.  This is called the lead time and is an important process output metric. We now know it is possible to complete the work in 30 mins so we can set this as our lead time expectation.  

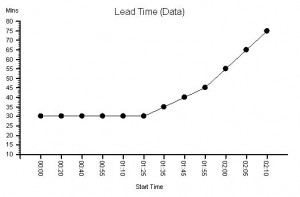
Suppose we plot a chart of lead times in the order that the tasks start and record the start time and lead time for each one – and we get a chart that looks like this. It is called a lead time run chart.  The first six tasks complete in 30 mins as expected – then it all goes pear-shaped. But why?  The run chart does not tell  us the reason – it just alerts us to dig deeper. 

The clue is in the run chart but we need to know what to look for.  We do not know how to do that yet so we need to ask for some more data.

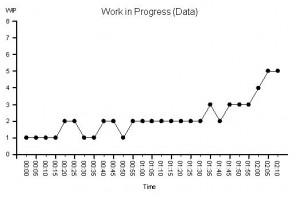
We are given this run chart – which is a count of the number of tasks being worked on recorded at 5 minute intervals. It is the work in progress run chart.

We know that we have a three step process and three separate resources – one for each step. So we know that that if there is a WIP of less than 3 we must have idle resources; and if there is a WIP of more than 3 we must have queues of tasks waiting.

We can see that the WIP run chart looks a bit like the lead time run chart.  But it still does not tell us what is causing the unstable behaviour.

In fact we do already have all the data we need to work it out but it is not intuitively obvious how to do it. We feel we need to dig deeper.

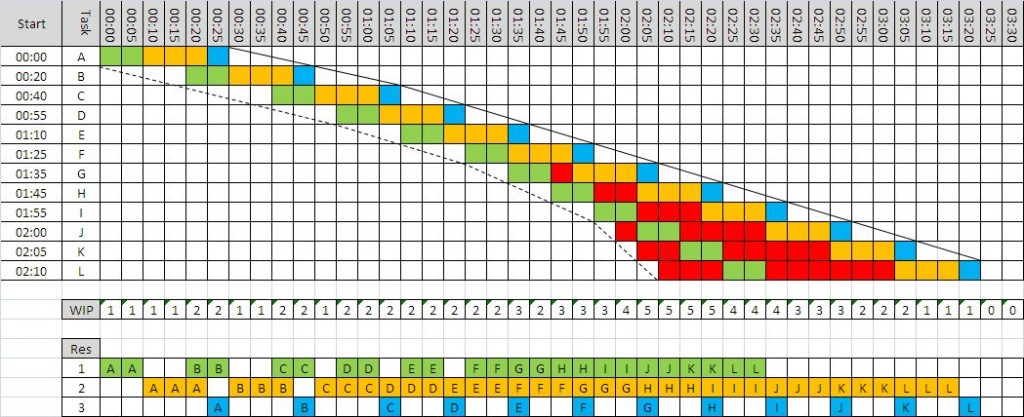
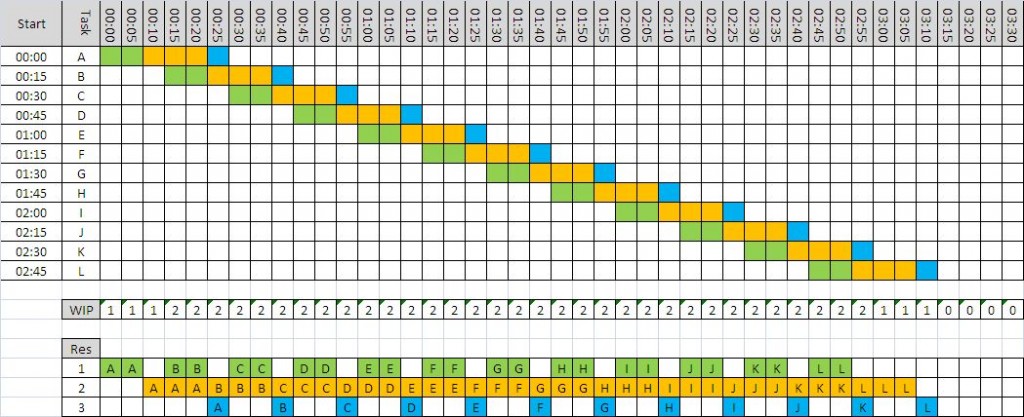
 We decide to go and see for ourselves and to observe exactly what happens to each of the twelve tasks and each of the three resources. We use these observations to draw a Gantt chart.

Now we can see what is happening.

We can see that the cycle time of Step 1 (green) is 10 mins; the cycle time for Step 2 (amber) is 15 mins; and the cycle time for Step 3 (blue) is 5 mins.


This explains why the minimum lead time was 30 mins: 10+15+5 = 30 mins. OK – that makes sense now.

Red means tasks waiting and we can see that a lead time longer than 30 mins is associated with waiting – which means one or more queues.  We can see that there are two queues – the first between Step 1 and Step 2 which starts to form at Task G and then grows; and the second before Step 1 which first appears for Task J  and then grows. So what changes at Task G and Task J?

Looking at the chart we can see that the slope of the left hand edge is changing – it is getting steeper – which means tasks are arriving faster and faster. We look at the interval between the start times and it confirms our suspicion. This data was the clue in the original lead time run chart. 

Looking more closely at the differences between the start times we can see that the first three arrive at one every 20 mins; the next three at one every 15 mins; the next three at one every 10 mins and the last three at one every 5 mins.

Ah ha!

Tasks are being pushed  into the process at an increasing rate that is independent of the rate at which the process can work.     

When we compare the rate of arrival with the cycle time of each step in a process we find that one step will be most exposed – it is called the constraint step and it is the step that controls the flow in the whole process. The constraint cycle time is therefore the critical metric that determines the maximum flow in the whole process – irrespective of how many steps it has or where the constraint step is situated.

If we push tasks into the process slower than the constraint cycle time then all the steps in the process will be able to keep up and no queues will form – but all the resources will be under-utilised. Tasks A to C;

If we push tasks into the process faster than the cycle time of any step then queues will grow upstream of these multiple constraint steps – and those queues will grow bigger, take up space and take up time, and will progressively clog up the resources upstream of the constraints while starving those downstream of work. Tasks G to L.

The optimum is when the work arrives at the same rate as the cycle time of the constraint – this is called pull and it means that the constraint is as the pacemaker and used to pull the work into the process. Tasks D to F.

With this new understanding we can see that the correct rate to load this process is one task every 15 mins – the cycle time of Step 2.

We can use a Gantt chart to predict what would happen.

The waiting is eliminated, the lead time is stable and meeting our expectation, and when task B arrives thw WIP is 2 and stays stable.

In this example we can see that there is now spare capacity at the end for another task – we could increase our productivity; and we can see that we need less space to store the queue which also improves our productivity.  Everyone wins. This is called pull scheduling.  Pull is a more productive design than push. 

To improve process productivity it is necessary to measure the sequence and cycle time of every step in the process.  Without that information it is impossible to understand and rationally improve our process.     

BUT in reality we have to deal with variation – in everything – so imagine how hard it is to predict how a multi-step process will behave when work is being pumped into it at a variable rate and resources come and go! No wonder so many processes feel unpredictable, chaotic, unstable, out-of-control and impossible to both understand and predict!

This feeling is an illusion because by learning and using the tools and techniques of Improvement Science it is possible to design and predict-within-limits how these complex systems will behave.  Improvement Science can unravel this Gordian knot!  And it is not intuitively obvious. If it were we would be doing it.

The Three Faces of Improvement Science

There is always more than one way to look at something and each perspective is complementary to the others.

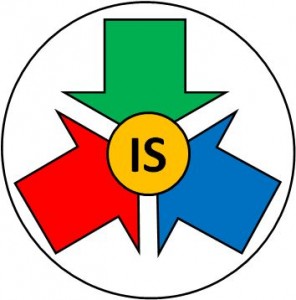
Improvement Science has three faces: the first is the Process Face; the second is the People face and the third is the System face – and is represented in the logo with a different colour for each face.

The process face is the easiest to start with because it is logical, objective and absolute.  It describes the process; the what, where, when and how. It is the combination of the hardware and the software; the structure and the function – and it is constrained by the Laws of Physics.

The people face is emotional, subjective and relative.  It describes the people and their perceptions and their purposes. Each person interacts both with the process and with each other and their individual beliefs and behaviours drive the web of relationships. This is the world of psychology and politics.

The system face is neither logical nor emotional – it has characteristics that are easy to describe but difficult to define. Characteritics such a self-organisation; emergent behaviour; and complexity.  Our brains do not appear to be able to comprehend systems as easily and intuitively and we might like to believe. This is one reason why systems often feel counter-intuitive, unpredictable and mysterious. We discover that we are unable to make intuitive decisions that result in whole system improvement  because our intuition tricks us.

Gaining confidence and capability in the practical application of Improvement Science requires starting from our zone of relative strength – our conscious, logical, rational, explanable, teachable, learnable, objective dependency on the physical world. From this solid foundation we can explore our zone of self-control – our internal unconscious, psychological and emotional world; and from there to our zone of relative weakness –  the systemic world of multiple interdependencies that, over time, determine our individual and collective fate.

The good news is that the knowledge and skills we need to handle the rational physical process face are easy and quick to learn.  It can be done with only a short period of focussed, learning-by-doing.  With that foundation in place we can then explore the more difficult areas of people and systems.


Flap-Flop-Flip

The world seems to is getting itself into a real flap at the moment.

The global economy is showing signs of faltering – the perfect dream of eternal financial growth seems to be showing cracks and is increasingly looking tarnished.

The doom mongers are surprisingly quiet – perhaps because they do not have any new ideas either.


It feels like the system is heading for a big flop and that is not a great feeling.

Last week I posed the Argument-Free-Problem-Solving challenge – and some were curious enough to have a go. It seems that the challenge needs more explanation of how it works to create enough engagement to climb the skepticism barrier.

At the heart of the AFPS method is The 4N Chart® – a simple, effective and efficient way to get a balanced perspective of the emotional contours of the change terrain.  The improvement process boils down to recognising, celebrating, and maintaining the Nuggets, flipping the Niggles into NoNos and reinvesting the currencies that are released into converting NiceIfs into more Nuggets.

The trick is the flip.


To perform a flip we have to make our assumptions explicit – which means we have to use external reality to challenge our internal rhetoric.  We need real data – presented in an easily digestible format – as a picture – and in context which converts the data into information that we can then ingest and use to grow our knowledge and broaden our understanding.

To convert knowledge into understanding we must ask a question: “Is our assumption a generalisation from a specific experience?

For example – it is generally assumed that high utilisation is associated with high productivity – and we want high productivity so we push for high utilisation.  And if we look at reality we can easily find evidence to support our assumption.  If I have under-utilised fixed-cost resources and I push more work into the process, I see an increase the flow in the stream, and an increase in utilisation, and an increase in revenue, and no increase in cost – higher outcome: higher productivity.

But if we look more carefully we can also find examples that seem to disprove our assumption. I have under-utilised resources and I push more work into the process, and the flow increases initially then falls dramatically, the revenue falls, productivity falls and when I look at all my resources they are still fully utilised.  The system has become gridlocked – and when I investigate is discover that the resource I need to unlock the flow is tied up somewhere else in the process with more urgent work. My system does not have an anti-deadlock design.

Our rhetoric of generalisation has been challenged by the reality of specifics – and it only takes one example.  One black swan will disprove the generalisation that “all swans are white”.

We now know we need to flip the “general assumption” into “specific evidence” – changing the words “all”, “always”, “none” and “never” into “some” and “sometimes”.

In our example we flip our assumption into “sometimes utilisation and productivity go up together, and sometimes they do not”. This flip reveals a new hidden door in the invisible wall that limits the breadth of our understanding and that unconsciously hinders our progress.

To open that door we must learn how to tell one specific from another and opening that door will lead to a path of discovery, more knowledge, broader understanding, deeper wisdom, better decisions, more effective actions and sustained improvement.

Flap-Flop-Flip.


This week has seen the loss of one of the greatest Improvement Scientists – Steve Jobs – creator of Apple – who put the essence of Improvement Science into words more eloquently than anyone in his 2005 address at Stanford University.

“Your time is limited, so don’t waste it living someone else’s life. Don’t be trapped by dogma – which is living with the results of other people’s thinking. Don’t let the noise of other’s opinions drown out your own inner voice. And most important, have the courage to follow your heart and intuition. They somehow already know what you truly want to become. Everything else is secondary.” Steve Jobs (1955-2011).

And with a lifetime of experience of leading an organisation that epitomises quality by design Steve Jobs had the most credibility of any person on the planet when it comes to management of improvement.

Argument-Free-Problem-Solving

I used to be puzzled when I reflected on the observation that we seem to be able to solve problems as individuals much more quickly and with greater certainty than we could as groups.

I used to believe that having many different perspectives of a problem would be an asset – but in reality it seems to be more of a liability.

Now when I receive an invitation to a meeting to discuss an issue of urgent importance my little heart sinks as I recall the endless hours of my limited life-time wasted in worthless, unproductive discussion.

But, not to be one to wallow in despair I have been busy applying the principles of Improvement Science to this ubiquitous and persistent niggle.  And I have discovered something called Argument Free Problem Solving (AFPS) – or rather that is my name for it because it does what it says on the tin – it solves problems without arguments.

The trick was to treat problem-solving as a process; to understand how we solve problems as individuals; what are the worthwhile bits; and how we scupper the process when we add-in more than one person; and then how to design-to-align the  problem-solving workflow so that it …. flows. So that it is effective and efficient.

The result is AFPS and I’ve been testing it out. Wow! Does it work or what!

I have also discovered that we do not need to create an artificial set of Rules or a Special Jargon – we can  apply the recipe to any situation in a very natural and unobtrusive way.  Just this week I have seen it work like magic several times: once in defusing what was looking like a big bust up looming; once t0 resolve a small niggle that had been magnified into a huge monster and a big battle – the smoke of which was obscuring the real win-win-win opportunity; and once in a collaborative process improvement exercise that demonstrated a 2000% improvement in system productivity – yes – two thousand percent!

So AFPS  has been added to the  Improvement Science treasure chest and (because I like to tease and have fun) I have hidden the key in cyberspace at coordinates  http://www.saasoft.com/moodle

Mwah ha ha ha – me hearties! 

The Cost of Distrust

Previously we have explored “costs” associated with processes and systems – costs that could be avoided through the effective application of Improvement Science. The Cost of Errors. The Cost of Queues. The Cost of Variation.

These costs are large, additive and cumulative and yet they pale into insignificance when compared with the most potent source of cost. The Cost of Distrust.

The picture is of Sue Sheridan and the link below is to a video of Sue telling her story of betrayed trust: in a health care system.  She describes the tragic consequences of trust-eroding health care system behaviour.  Sue is not bitter though – she remains hopeful that her story will bring everyone to the table of Safety Improvement

View the Video

The symptoms of distrust are easy to find. They are written on the faces of the people; broadcast in the way they behave with each other; heard in what they say; and felt in how they say it. The clues are also in what they do not do and what they do not say. What is missing is as important as what is present.

There are also tangible signs of distrust too – checklists, application-for-permission forms, authorisation protocols, exception logs, risk registers, investigation reports, guidelines, policies, directives, contracts and all the other machinery of the Bureaucracy of Distrust. 

The intangible symptoms of distrust and the tangible signs of distrust both have an impact on the flow of work. The untrustworthy behaviour creates dissatisfaction, demotivation and conflict; the bureaucracy creates handoffs, delays and queues.  All  are potent sources of more errors, delays and waste.

The Cost of Distrust is is counted on all three dimensions – emotional, temporal and financial.

It may appear impossible to assign a finanical cost of distrust because of the complex interactions between the three dimensions in a real system; so one way to approach it is to estimate the cost of a high-trust system.  A system in which the trustworthy behaviour is explicit and trust eroding behaviour is promptly and respectfully challenged.

Picture such a system and consider these questions:

  • How would it feel to work in a high-trust  system where you know that trust-eroding-behaviour will be challenged with respect?
  • How would it feel to be the customer of a high-trust system?
               
  • What would be the cost of a system that did not need the Bureaucracy of Distrust to deliver safety and quality?

Trust eroding behaviours are not reduced by decree, threat, exhortation, name-shame-blame, or pleading because all these behaviours are based on the assumption of distrust and say “I do not trust you to do this without my external motivation”. These attitudes behaviours give away the “I am OK but You are Not OK” belief.

Trust eroding behaviours are most effectively reduced by a collective charter which is when a group of people state what behaviours they do not expect and individually commit to avoiding and challenging. The charter is the tangible sign of the peer support that empowers everyone to challenge with respect because they have collective authority to do so. Authority that is made explicit through the collective charter: “We the undersigned commit to respectfully challenge the following trust eroding behaviours …”.

It requires confidence and competence to open a conversation about distrust with someone else and that confidence comes from insight, instruction and practice. The easiest person to practice with is ourselves – it takes courage to do and it is worth the investment – which is asking and answering two questions:

Q1: What behaviours would erode my trust in someone else?

Make a list and rank on order with the most trust-eroding at the top. 

Q2: Do I ever exhibit any of the behaviours I have just listed?

Choose just one  from your list that you feel you can commit to – and make a promose to yourself – every time you demonstrate the behaviour make a mental note of:

  • When it happened?
  • Where it happened?
  • Who was present?
  • What just happened?
  • How did you feel?

You do not need to actively challange your motives,  or to actively change your behaviour – you just need to connect up your own emotional feedback loop.  The change will happen as if by magic!

Doing Our Way to New Thinking.

Most of our thinking happens out of awareness – it is unconscious. Most of the data that pours in through our senses never reaches awareness either – but that does not mean it does not have an impact on what we remember, how we feel and what we decide and do in the future. It does.

Improvement Science is the knowledge of how to achieve sustained change for the better; and doing that requires an ability to unlearn unconscious knowledge that blocks our path to improvement – and to unlearn selectively.

So how can we do that if it is unconscious? Well, there are  at least two ways:

1. Bring the unconscious knowledge to the surface so it can be examined, sorted, kept or discarded. This is done through the social process of debate and discussion. It does work though it can be a slow and difficult process.

2. Do the unlearning at the unconscious level – and we can do that by using reality rather than rhetoric. The easiest way to connect ourselves to reality is to go out there and try doing things.

When we deliberately do things  we are learning unconsciously because most of our sensory data never reaches awareness.  When we are just thinking the unconscious is relatively unaffected: talking and thinking are the same conscious process. Discussion and dialog operate at the conscious level but differ in style – discussion is more competitive; dialog is more collaborative. 

The door to the unconscious is controlled by emotions – and it appears that learning happens more effectively and more efficiently in certain emotional states. Some emotional states can impair learning; such as depression, frustration and anxiety. Strong emotional states associated with dramatic experiences can result in profound but unselective learning – the emotionally vivid memories that are often associated with unpleasant events.  Sometimes the conscious memory is so emotionally charged and unpleasant that it is suppressed – but the unconscious memory is not so easily erased – so it continues to influence but out of awareness. The same is true for pleasant emotional experiences – they can create profound learning experiences – and the conscious memory may be called an inspirational or “eureka” moment – a sudden emotional shift for the better. And it too is unselective and difficult to erase.

An emotionally safe environment for doing new things and having fun at the same time comes close to the ideal context for learning. In such an enviroment we learn without effort. It does not feel like work – yet we know we have done work because we feel tired afterwards.  And if we were to record the way that we behave and talk before the doing; and again afterwards then we will measure a change even though we may not notice the change ourselves. Other people may notice before we do – particularly if the change is significant – or if they only interact with us occasionally.

It is for this reason that keeping a personal journal is an effective way to capture the change in ourselves over time.  

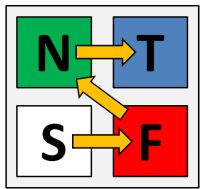
The Jungian model of personality types states that there are three dimensions to personality (Isabel Briggs Myers added a fourth later to create the MBTI®).

One dimension describes where we prefer to go for input data – sensors (S) use external reality as their reference – intuitors (N) use their internal rhetoric.

Another dimension is how we make decisions –  thinkers (T) prefer a conscious, logical, rational, sequential decision process while feelers (F) favour an unconscious, emotional, “irrational”, parallel approach.

The third dimension is where we direct the output of our decisions – extraverts (E) direct it outwards into the public outside world while intraverts (I) direct it inwards to their private inner world.

Irrespective of our individual preferences, experience suggests that an effective learning sequence starts with our experience of reality (S) and depending how emotionally loaded it is (F) we may then internalise the message as a general intuitive concept (N) or a specific logical construct (T).

The implication of this is that to learn effectively and efficiently we need to be able to access all four modes of thinking and to do that we might design our teaching methods to resonate with this natural learning sequence, focussing on creating surprisingly positive reality based emotional experiences first. And we must be mindful that if we skip steps or create too many emotionally negative experiences we we may unintentionally impair the effectiveness of the learning process.

A carefully designed practical exercise that takes just a few minutes to complete can be a much more effective and efficient way to teach a profound principle than to read libraries of books or to listen to hours of rhetoric.  Indeed some of the most dramatic shifts in our understanding of the Universe have been facilitated by easily repeatable experiments.

Intuition and emotions can trick us – so Doing Our Way to New Thinking may be a better improvement strategy.

Focus-on-the-Flow

One of the foundations of Improvement Science is visualisation – presenting data in a visual format that we find easy to assimilate quickly – as pictures.

We derive deeper understanding from observing how things are changing over time – that is the reality of our everyday experience.

And we gain even deeper understanding of how the world behaves by acting on it and observing the effect of our actions. This is how we all learned-by-doing from day-one. Most of what we know about people, processes and systems we learned long before we went to school.


When I was at school the educational diet was dominated by rote learning of historical facts and tried-and-tested recipes for solving tame problems. It was all OK – but it did not teach me anything about how to improve – that was left to me.

More significantly it taught me more about how not to improve – it taught me that the delivered dogma was not to be questioned. Questions that challenged my older-and-better teachers’ understanding of the world were definitely not welcome.

Young children ask “why?” a lot – but as we get older we stop asking that question – not because we have had our questions answered but because we get the unhelpful answer “just because.”

When we stop asking ourselves “why?” then we stop learning, we close the door to improvement of our understanding, and we close the door to new wisdom.


So to open the door again let us leverage our inborn ability to gain understanding from interacting with the world and observing the effect using moving pictures.

Unfortunately our biology limits us to our immediate space-and-time, so to broaden our scope we need to have a way of projecting a bigger space-scale and longer time-scale into the constraints imposed by the caveman wetware between our ears.

Something like a video game that is realistic enough to teach us something about the real world.

If we want to understand better how a health care system behaves so that we can make wiser decisions of what to do (and what not to do) to improve it then a real-time, interactive, healthcare system video game might be a useful tool.

So, with this design specification I have created one.

The goal of the game is to defeat the enemy – and the enemy is intangible – it is the dark cloak of ignorance – literally “not knowing”.

Not knowing how to improve; not knowing how to ask the “why?” question in a respectful way.  A way that consolidates what we understand and challenges what we do not.

And there is an example of the Health Care System Flow Game being played here.

Design-for-Productivity

One tangible output of process or system design exercise is a blueprint.

This is the set of Policies that define how the design is built and how it is operated so that it delivers the specified performance.

These are just like the blueprints for an architectural design, the latter being the tangible structure, the former being the intangible function.

A computer system has the same two interdependent components that must be co-designed at the same time: the hardware and the software.


The functional design of a system is manifest as the Seven Flows and one of these is Cash Flow, because if the cash does not flow to the right place at the right time in the right amount then the whole system can fail to meet its design requirement. That is one reason why we need accountants – to manage the money flow – so a critical component of the system design is the Budget Policy.

We employ accountants to police the Cash Flow Policies because that is what they are trained to do and that is what they are good at doing – they are the Guardians of the Cash.

Providing flow-capacity requires providing resource-capacity, which requires providing resource-time; and because resource-time-costs-money then the flow-capacity design is intimately linked to the budget design.

This raises some important questions:
Q: Who designs the budget policy?
Q: Is the budget design done as part of the system design?
Q: Are our accountants trained in system design?

The challenge for all organisations is to find ways to improve productivity, to provide more for the same in a not-for-profit organisation, or to deliver a healthy return on investment in the for-profit arena (and remember our pensions are dependent on our future collective productivity).

To achieve the maximum cash flow (i.e. revenue) at the minimum cash cost (i.e. expense) then both the flow scheduling policy and the resource capacity policy must be co-designed to deliver the maximum productivity performance.


If we have a single-step process it is relatively easy to estimate both the costs and the budget to generate the required activity and revenue; but how do we scale this up to the more realistic situation when the flow of work crosses many departments – each of which does different work and has different skills, resources and budgets?

Q: Does it matter that these departments and budgets are managed independently?
Q: If we optimise the performance of each department separately will we get the optimum overall system performance?

Our intuition suggests that to maximise the productivity of the whole system we need to maximise the productivity of the parts.  Yes – that is clearly necessary – but is it sufficient?


To answer this question we will consider a process where the stream flows though several separate steps – separate in the sense that that they have separate budgets – but not separate in that they are linked by the same flow.

The separate budgets are allocated from the total revenue generated by the outflow of the process. For the purposes of this exercise we will assume the goal is zero profit and we just need to calculate the price that needs to be charged the “customer” for us to break even.

The internal reports produced for each of our departments for each time period are:
1. Activity – the amount of work completed in the period.
2. Expenses – the cost of the resources made available in the period – the budget.
3. Utilisation – the ratio of the time spent using resources to the total time the resources were available.

We know that the theoretical maximum utilisation of resources is 100% and this can only be achieved when there is zero-variation. This is impossible in the real world but we will assume it is achievable for the purpose of this example.

There are three questions we need answers to:
Q1: What is the lowest price we can achieve and meet the required demand?
Q2: Will optimising each step independently step give us this lowest price?
Q3: How do we design our budgets to deliver maximum productivity?


To explore these questions let us play with a real example.

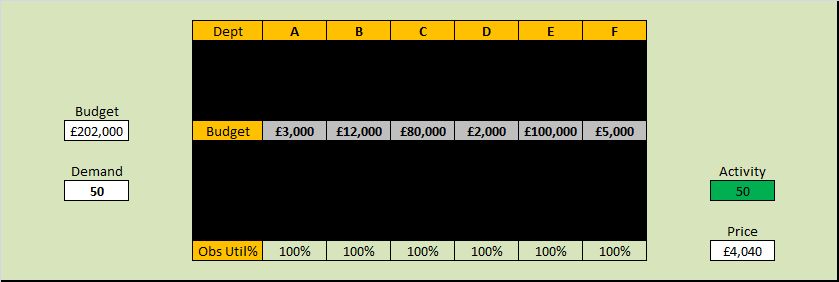
Let us assume we have a single stream of work that crosses six separate departments labelled A-F in that sequence. The department budgets have been allocated based on historical activity and utilisation and our required activity of 50 jobs per time period. We have already worked hard to remove all the errors, variation and “waste” within each department and we have achieved 100% observed utilisation of all our resources. We are very proud of our high effectiveness and our high efficiency.

Our current not-for-profit price is £202,000/50 = £4,040 and because our observed utilisation of resources at each step is 100% we conclude this is the most efficient design and that this is the lowest possible price.

Unfortunately our celebration is short-lived because the market for our product is growing bigger and more competitive and our market research department reports that to retain our market share we need to deliver 20% more activity at 80% of the current price!

A quick calculation shows that our productivity must increase by 50% (New Activity/New Price = 120%/80% = 150%) but as we already have a utilisation of 100% then this challenge looks hopelessly impossible.  To increase activity by 20% will require increasing flow-capacity by 20% which will imply a 20% increase in costs so a 20% increase in budget – just to maintain the current price.  If we no longer have customers who want to pay our current price then we are in trouble.

Fortunately our conclusion is incorrect – and it is incorrect because we are not using the data available to co-design the system such that cash flow and work flow are aligned.  And we do not do that because we have not learned how to design-for-productivity.  We are not even aware that this is possible.  It is, and it is called Value Stream Accounting.

The blacked out boxes in the table above hid the data that we need to do this – an we do not know what they are. Yet.

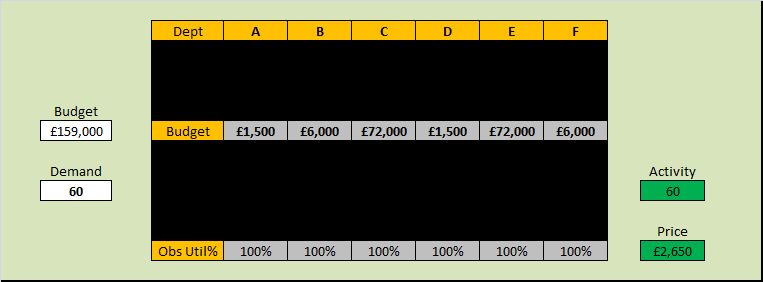
But if we apply the theory, techniques and tools of system design, and we use the data that is already available then we get this result …

 We can see that the total budget is less, the budget allocations are different, the activity is 20% up and the zero-profit price is 34% less – which is a 83% increase in productivity!

More than enough to stay in business.

Yet the observed resource utilisation is still 100%  and that is counter-intuitive and is a very surprising discovery for many. It is however the reality.

And it is important to be reminded that the work itself has not changed – the ONLY change here is the budget policy design – in other words the resource capacity available at each stage.  A zero-cost policy change.

The example answers our first two questions:
A1. We now have a price that meets our customers needs, offers worthwhile work, and we stay in business.
A2. We have disproved our assumption that 100% utilisation at each step implies maximum productivity.

Our third question “How to do it?” requires learning the tools, techniques and theory of System Engineering and Design.  It is not difficult and it is not intuitively obvious – if it were we would all be doing it.

Want to satisfy your curiosity?
Want to see how this was done?
Want to learn how to do it yourself?

You can do that here.


For more posts like this please vote here.
For more information please subscribe here.

Harried to the Rescue!

We are social animals and we need social interaction with others of our kind – it is the way our caveman wetware works.

And we need it as much as we need air, water, food and sleep. Solitary confinement is an effective punishment – you don’t need to physically beat someone to psychologically hurt them – just actively excluding them or omitting to notice them is effective and has the advantage that it leaves no visible marks – and no trail of incriminating evidence.

This is the Dark Art of the Game Player and the act of social omission is called discounting – so once we know what to look for the signature of the Game Player is obvious – and we can choose to play along or not.

Some people have learned how to protect themselves from gamey behaviour – they have learned to maintain a healthy balance of confidence and humility. They ask for feedback, they know their strengths and their weaknesses, and they and strive to maintain and develop their capability through teaching and learning. Sticks and stones may break their bones but names can never hurt them.

Other people have not learned how to spot the signs and to avoid being sucked into games – they react to the discounting by trying harder, working harder, taking on more and more – all to gain morsels of recognition. Their strategy works but it has an unfortunate consequence – it becomes an unconscious habit and they become players of the game called “Harried”.  The start is signalled by a big sigh as they are hooked into their preferred Rescuer role – always there to pick up the pieces – always offering to talke on extra work – always on the look out for an opportunity to take on more burden. “Good Ol’ Harried” they hear “S/he works every hour God sends like a Trojan”. The unspoken ulterior motive of the instigator of the game is less admirable “Delegate the job to Harried – or better still – just mess it up a bit do nothing – just wait – Harried will parachute in and save the day – and save me having to do it myself.” The conspirators in the game are adopting different roles – Victim and Persecutor – and it is in their interest to have Rescuers around who will willingly join the game. The Persecutors are not easy to see because their behaviour is passive – discounting is passive aggressive behaviour – they discount others need for a work-life balance. The Victims are easier to spot – they claim not be able to solve their own problems by acting helpless and letting Harried take over. And the whole social construct is designed with one purpose – to create a rich opportunity for social interaction – because even though they are painful, games are better than solitary anonymity.

According to Eric Berne, founder of the school of Transactional Analysis, games are learned behaviour – and they spring from an injunction that we are all taught as children: that each of us is reliant on others for recognition – and those others are our parents. Sure, recognition from influential others is important BUT it is not our only source. We can give ourselves recognition. Each of us can learn to celebrate a job well done; a lesson learned; a challenge overcome – and through that route we can learn to recognise others genuinely, openly and without expectation of a return compliment. But to learn this we have to grasp the nettle and to unlearn our habit of playing the Persecutor-Rescuer-Victim games; and to do that we must first shine a light onto our blindspots.

Gamey behaviour is a potent yet invisible barrier to improvement. So if it is endemic in an organisation that wants to improve then it needs to be diagnosed and managed as an integral part of the improvement process. It is a critical human factor and in Improvement Science the human factors and the  process factors progress hand in hand.

Here is an paragraph from Games Nurses Play by Pamela Levin:

“Harried” is a game played when situations are complicated. The aim is to make the situation even more complicated so that a person feels justified in giving up. “Harried Midwife” is so named because I (P.L.) first observed the game on an obstetric floor, but it has its counterpart in other clinical settings. The game is aided by institutional needs, since it is a rare hospital unit that has the staff adequate in numbers these days. In the situation I observed, the harried nurse sent her only nurse’s aide to lunch when three deliveries were pending. Instead of using a methodical approach, she went running about checking a pulse here, a chart there, a dilatation here, and an I.V. there, so she never was caught up with the work. She lost her pen and couldn’t “chart” until she found it. She answered the telephone and lost the message. She was so busy setting up the delivery room, she forgot to notify the doctor of the impending delivery. The baby, which arrived in the labor room, was considered contaminated, and could not be discharged to the newborn nursery. After the chaos had died down, the nurse felt justified in doing almost no work for the rest of the day.

Click for the complete Games Nurses Play article here

Lub-Hub Lub-Hub Lub-Hub

If you put an ear to someones chest you can hear their heart “lub-dub lub-dub lub-dub”. The sound is caused by the valves in the heart closing, like softly slamming doors, as part of the wonderfully orchestrated process of pumping blood around the lungs and body. The heart is an impressive example of bioengineering but it was not designed – it evolved over time – its elegance and efficiency emerged over a long journey of emergent evolution.  The lub-dub is a comforting sound – it signals regularity, predictability, and stabilty; and was probably the first and most familiar sound each of heard in the womb. Our hearts are sensitive to our emotional state – and it is no accident that the beat of music mirrors the beat of the heart: slow means relaxed and fast means aroused.

Systems and processes have a heart beat too – but it is not usually audible. It can been seen though if the measures of a process are plotted as time series charts. Only artificial systems show constant and unwavering behaviour – rigidity –  natural systems have cycles.  The charts from natural systems show the “vital signs” of the system.  One chart tells us something of value – several charts considered together tell us much more.

We can measure and display the electrical activity of the heart over time – it is called an electrocardiogram (ECG) -literally “electric-heart-picture”; we can measure and display the movement of muscles, valves and blood by beaming ultrasound at the heart – an echocardiogram; we can visualise the pressure of the blood over time – a plethysmocardiogram; and we can visualise the sound the heart makes – a phonocardiogram. When we display the various cardiograms on the same time scale one above the other we get a much better understanding of how the heart is behaving  as a system. And if we have learned what to expect to see with in a normal heart we can look for deviations from healthy behaviour and use those to help us diagnose the cause.  With experience the task of diagnosis becomes a simple, effective and efficient pattern matching exercise.

The same is true of systems and processes – plotting the system metrics as time-series charts and searching for the tell-tale patterns of process disease can be a simple, quick and accurate technique: when you have learned what a “healthy” process looks like and which patterns are caused by which process “diseases”.  This skill is gained through Operations Management training and lots of practice with the guidance of an experienced practitioner. Without this investment in developing knowlewdge and understanding there is a high risk of making a wrong diagnosis and instituting an ineffective or even dangerous treatment.  Confidence is good – competence is even better.

The objective of process diagnostics is to identify where and when the LUBs and HUBs appear are in the system: a LUB is a “low utilisation bottleneck” and a HUB is a “high utilisation bottleneck”.  Both restrict flow but they do it in different ways and therefore require different management. If we confuse a LUB for a HUB and choose the wrong treatent we can unintentionally make the process sicker – or even kill the system completely. The intention is OK but if we are not competent the implementation will not be OK.

Improvement Science rests on two foundations stones – Operations Management and Human Factors – and managers of any process or system need an understanding of both and to be able to apply their knowledge in practice with competence and confidence.  Just as a doctor needs to understand how the heart works and how to apply this knowledge in clinical practice. Both technical and emotional capability is needed – the Head and the Heart need each other.                          

Safety-By-Design

The picture is of Elisha Graves Otis demonstrating, in the mid 19th century, his safe elevator that automatically applies a brake if the lift cable breaks. It is a “simple” fail-safe mechanical design that effectively created the elevator industry and the opportunity of high-rise buildings.

“To err is human” and human factors research into how we err has revealed two parts – the Error of Intention (poor decision) and the Error of Execution (poor delivery) – often referred to as “mistakes” and “slips”.

Most of the time we act unconsciously using well practiced skills that work because most of our tasks are predictable; walking, driving a car etc.

The caveman wetware between our ears has evolved to delegate this uninteresting and predictable work to different parts of the sub-conscious brain and this design frees us to concentrate our conscious attention on other things.

So, if something happens that is unexpected we may not be aware of it and we may make a slip without noticing. This is one way that process variation can lead to low quality – and these are the often the most insidious slips because they go unnoticed.

It is these unintended errors that we need to eliminate using safe process design.

There are two ways – by designing processes to reduce the opportunity for mistakes (i.e. improve our decision making); and then to avoid slips by designing the subsequent process to be predictable and therefore suitable for delegation.

Finally, we need to add a mechanism to automatically alert us of any slips and to protect us from their consequences by failing-safe.  The sign of good process design is that it becomes invisible – we are not aware of it because it works at the sub-conscious level.

As soon as we become aware of the design we have either made a slip – or the design is poor.


Suppose we walk up to a door and we are faced with a flat metal plate – this “says” to us that we need to “push” the door to open it – it is unambiguous design and we do not need to invoke consciousness to make a push-or-pull decision.  The technical term for this is an “affordance”.

In contrast a door handle is an ambiguous design – it may require a push or a pull – and we either need to look for other clues or conduct a suck-it-and-see experiment. Either way we need to switch our conscious attention to the task – which means we have to switch it away from something else. It is those conscious interruptions that cause us irritation and can spawn other, possibly much bigger, slips and mistakes.

Safe systems require safe processes – and safe processes mean fewer mistakes and fewer slips. We can reduce slips through good design and relentless improvement.

A simple and effective tool for this is The 4N Chart® – specifically the “niggle” quadrant.

Whenever we are interrupted by a poorly designed process we experience a niggle – and by recording what, where and when those niggles occur we can quickly focus our consciousness on the opportunity for improvement. One requirement to do this is the expectation and the discipline to record niggles – not necessarily to fix them immediately – but just to record them and to review them later.

In his book “Chasing the Rabbit” Steven Spear describes two examples of world class safety: the US Nuclear Submarine Programme and Alcoa, an aluminium producer.  Both are potentially dangerous activities and, in both examples, their world class safety record came from setting the expectation that all niggles are recorded and acted upon – using a simple, effective and efficient niggle-busting process.

In stark and worrying contrast, high-volume high-risk activities such as health care remain unsafe not because there is no incident reporting process – but because the design of the report-and-review process is both ineffective and inefficient and so is not used.

The risk of avoidable death in a modern hospital is quoted at around 1:300 – if our risk of dying in an elevator were that high we would take the stairs!  This worrying statistic is to be expected though – because if we lack the organisational capability to design a safe health care delivery process then we will lack the organisational capability to design a safe improvement process too.

Our skill gap is clear – we need to learn how to improve process safety-by-design.


Download Design for Patient Safety report written by the Design Council.

Other good examples are the WHO Safer Surgery Checklist, and the story behind this is told in Dr Atul Gawande’s Checklist Manifesto.

Low-Tech-Toc

Beware the Magicians who wave High Technology Wands and promise Miraculous Improvements if you buy their Black Magic Boxes!

If a Magician is not willing to open the box and show you the inner workings then run away – quickly.  Their story may be true, the Miracle may indeed be possible, but if they cannot or will not explain HOW the magic trick is done then you will be caught in their spell and will become their slave forever.

Not all Magicians have honourable intentions – those who have been seduced by the Dark Side will ensnare you and will bleed you dry like greedy leeches!

In the early 1980’s a brilliant innovator called Eli Goldratt created a Black Box called OPT that was the tangible manifestation of his intellectual brainchild called ToC – Theory of Constraints. OPT was a piece of complex computer software that was intended to rescue manufacturing from their ignorance and to miraculously deliver dramatic increases in profit. It didn’t.

Eli Goldratt was a physicist and his Black Box was built on strong foundations of Process Physics – it was not Snake Oil – it did work.  The problem was that it did not sell: Not enough people believed his claims and those who did discovered that the Black Box was not as easy to use as the Magician suggested.  So Eli Goldratt wrote a book called The Goal in which he explained, in parable form, the Principles of ToC and the theoretical foundations on which his Black Box was built.  The book was a big success but his Black Box still did not sell; just an explanation of how his Black Box worked was enough for people to apply the Principles of ToC and to get dramatic results. So, Eli abandoned his plan of making a fortune selling Black Boxes and set up the Goldratt Institute to disseminate the Principles of ToC – which he did with considerably more success. Eli Goldratt died in June 2011 after a short battle with cancer and the World has lost a great innovator and a founding father of Improvement Science. His legacy lives on in the books he wrote that chart his personal journey of discovery.

The Principles of ToC are central both to process improvement and to process design.  As Eli unintentionally demonstrated, it is more effective and much quicker to learn the Principles of ToC pragmatically and with low technology – such as a book – than with a complex, expensive, high technology Black Box.  As many people have discovered – adding complex technology to a complex problem does not create a simple solution! Many processes are relatively uncomplicated and do not require high technology solutions. An example is the challenge of designing a high productivity schedule when there is variation in both the content and the volume of the work.

If our required goal is to improve productivity (or profit) then we want to improve the throughput and/or to reduce the resources required. That is relatively easy when there is no variation in content and no variation in volume – such as when we are making just one product at a constant rate – like a Model-T Ford in Black! Add some content and volume variation and the challenge becomes a lot trickier! From the 1950’s the move from mass production to mass customisation in the automobile industry created this new challenge and spawned a series of  innovative approaches such as the Toyota Production System (Lean), Six Sigma and Theory of Constraints.  TPS focussed on small batches, fast changeovers and low technology (kanbans or cards) to keep inventory low and flow high; Six Sigma focussed on scientifically identifying and eliminating all sources of variation so that work flows smoothly and in “statistical control”; ToC focussed on identifying the “constraint steps” in the system and then on scheduling tasks so that the constraints never run out of work.

When applied to a complex system of interlinked and interdependent processes the ToC method requires a complicated Black Box to do the scheduling because we cannot do it in our heads. However, when applied to a simpler system or to a part of a complex system it can be done using a low technology method called “paper and pen”. The technique is called Template Scheduling and there is a real example in the “Three Wins” book where the template schedule design was tested using a computer simulation to measure the resilience of the design to natural variation – and the computer was not used to do the actual scheduling. There was no Black Box doiung the scheduling. The outcome of the design was a piece of paper that defined the designed-and-tested template schedule: and the design testing predicted a 40% increase in throughput using the same resources. This dramatic jump in productivity might be regarded as  “miraculous” or even “impossible” but only to someone who was not aware of the template scheduling method. The reality is that that the designed schedule worked just as predicted – there was no miracle, no magic, no Magician and no Black Box.

What Is The Cost Of Reality?

It is often assumed that “high quality costs more” and there is certainly ample evidence to support this assertion: dinner in a high quality restaurant commands a high price. The usual justifications for the assumption are (a) quality ingredients and quality skills cost more to provide; and (b) if people want a high quality product or service that is in relatively short supply then it commands a higher price – the Law of Supply and Demand.  Together this creates a self-regulating system – it costs more to produce and so long as enough customers are prepared to pay the higher price the system works.  So what is the problem? The problem is that the model is incorrect. The assumption is incorrect.  Higher quality does not always cost more – it usually costs less. Convinced?  No. Of course not. To be convinced we need hard, rational evidence that disproves our assumption. OK. Here is the evidence.

Suppose we have a simple process that has been designed to deliver the Perfect Service – 100% quality, on time, first time and every time – 100% dependable and 100% predictable. We choose a Service for our example because the product is intangible and we cannot store it in a warehouse – so it must be produced as it is consumed.

To measure the Cost of Quality we first need to work out the minimum price we would need to charge to stay in business – the sum of all our costs divided by the number we produce: our Minimum Viable Price. When we examine our Perfect Service we find that it has three parts – Part 1 is the administrative work: receiving customers; scheduling the work; arranging for the necessary resources to be available; collecting the payment; having meetings; writing reports and so on. The list of expenses seems endless. It is the necessary work of management – but it is not what adds value for the customer. Part 3 is the work that actually adds the value – it is the part the customer wants – the Service that they are prepared to pay for. So what is Part 2 work? This is where our customers wait for their value – the queue. Each of the three parts will consume resources either directly or indirectly – each has a cost – and we want Part 3 to represent most of the cost; Part 2 the least and Part 1 somewhere in between. That feels realistic and reasonable. And in our Perfect Service there is no delay between the arrival of a customer and starting the value work; so there is  no queue; so no work in progress waiting to start, so the cost of Part 2 is zero.  

The second step is to work out the cost of our Perfect Service – and we could use algebra and equations to do that but we won’t because the language of abstract mathematics excludes too many people from the conversation – let us just pick some realistic numbers to play with and see what we discover. Let us assume Part 1 requires a total of 30 mins of work that uses resources which cost £12 per hour; and let us assume Part 3 requires 30 mins of work that uses resources which cost £60 per hour; and let us assume Part 2 uses resources that cost £6 per hour (if we were to need them). We can now work out the Minimum Viable Price for our Perfect Service:

Part 1 work: 30 mins @ £12 per hour = £6
Part 2 work:  = £0
Part 3 work: 30 mins at £60 per hour = £30
Total: £36 per customer.

Our Perfect Service has been designed to deliver at the rate of demand which is one job every 30 mins and this means that the Part 1 and Part 3 resources are working continuously at 100% utilisation. There is no waste, no waiting, and no wobble. This is our Perfect Service and £36 per job is our Minimum Viable Price.         

The third step is to tarnish our Perfect Service to make it more realistic – and then to do whatever is necessary to counter the necessary imperfections so that we still produce 100% quality. To the outside world the quality of the service has not changed but it is no longer perfect – they need to wait a bit longer, and they may need to pay a bit more. Quality costs remember!  The question is – how much longer and how much more? If we can work that out and compare it with our Minimim Viable Price we will get a measure of the Cost of Reality.

We know that variation is always present in real systems – so let the first Dose of Reality be the variation in the time it takes to do the value work. What effect does this have?  This apparently simple question is surprisingly difficult to answer in our heads – and we have chosen not to use “scarymatics” so let us run an empirical experiment and see what happens. We could do that with the real system, or we could do it on a model of the system.  As our Perfect Service is so simple we can use a model. There are lots of ways to do this simulation and the technique used in this example is called discrete event simulation (DES)  and I used a process simulation tool called CPS (www.SAASoft.com).

Let us see what happens when we add some random variation to the time it takes to do the Part 3 value work – the flow will not change, the average time will not change, we will just add some random noise – but not too much – something realistic like 10% say.

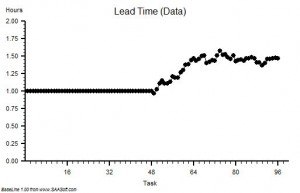
The chart shows the time from start to finish for each customer and to see the impact of adding the variation the first 48 customers are served by our Perfect Service and then we switch to the Realistic Service. See what happens – the time in the process increases then sort of stabilises. This means we must have created a queue (i.e. Part 2 work) and that will require space to store and capacity to clear. When we get the costs in we work out our new minimum viable price it comes out, in this case, to be £43.42 per task. That is an increase of over 20% and it gives us a measure of the Cost of the Variation. If we repeat the exercise many times we get a similar answer, not the same every time because the variation is random, but it is always an extra cost. It is never less that the perfect proce and it does not average out to zero. This may sound counter-intuitive until we understand the reason: when we add variation we need a bit of a queue to ensure there is always work for Part 3 to do; and that queue will form spontaneously when customers take longer than average. If there is no queue and a customer requires less than average time then the Part 3 resource will be idle for some of the time. That idle time cannot be stored and used later: time is not money.  So what happens is that a queue forms spontaneously, so long as there is space for it,  and it ensures there is always just enough work waiting to be done. It is a self-regulating system – the queue is called a buffer.

Let us see what happens when we take our Perfect Process and add a different form of variation – random errors. To prevent the error leaving the system and affecting our output quality we will repeat the work. If the errors are random and rare then the chance of getting it wrong twice for the same customer will be small so the rework will be a rough measure of the internal process quality. For a fair comparison let us use the same degree of variation as before – 10% of the Part 3 have an error and need to be reworked – which in our example means work going to the back of the queue.

Again, to see the effect of the change, the first 48 tasks are from the Perfect System and after that we introduce a 10% chance of a task failing the quality standard and needing to be reworked: in this example 5 tasks failed, which is the expected rate. The effect on the start to finish time is very different from before – the time for the reworked tasks are clearly longer as we would expect, but the time for the other tasks gets longer too. It implies that a Part 2 queue is building up and after each error we can see that the queue grows – and after a delay.  This is counter-intuitive. Why is this happening? It is because in our Perfect Service we had 100% utiliation – there was just enough capacity to do the work when it was done right-first-time, so if we make errors and we create extra demand and extra load, it will exceed our capacity; we have created a bottleneck and the queue will form and it will cointinue to grow as long as errors are made.  This queue needs space to store and capacity to clear. How much though? Well, in this example, when we add up all these extra costs we get a new minimum price of £62.81 – that is a massive 74% increase!  Wow! It looks like errors create much bigger problem for us than variation. There is another important learning point – random cycle-time variation is self-regulating and inherently stable; random errors are not self-regulating and they create inherently unstable processes.

Our empirical experiment has demonstrated three principles of process design for minimising the Cost of Reality:

1. Eliminate sources of errors by designing error-proofed right-first-time processes that prevent errors happening.
2. Ensure there is enough spare capacity at every stage to allow recovery from the inevitable random errors.
3. Ensure that all the steps can flow uninterrupted by allowing enough buffer space for the critical steps.

With these Three Principles of cost-effective design in mind we can now predict what will happen if we combine a not-for-profit process, with a rising demand, with a rising expectation, with a falling budget, and with an inspect-and-rework process design: we predict everyone will be unhappy. We will all be miserable because the only way to stay in budget is to cut the lower priority value work and reinvest the savings in the rising cost of checking and rework for the higher priority jobs. But we have a  problem – our activity will fall, so our revenue will fall, and despite the cost cutting the budget still doesn’t balance because of the increasing cost of inspection and rework – and we enter the death spiral of finanical decline.

The only way to avoid this fatal financial tailspin is to replace the inspection-and-rework habit with a right-first-time design; before it is too late. And to do that we need to learn how to design and deliver right-first-time processes.

Charts created using BaseLine

The Crime of Metric Abuse

We live in a world that is increasingly intolerant of errors – we want everything to be right all the time – and if it is not then someone must have erred with deliberate intent so they need to be named, blamed and shamed! We set safety standards and tough targets; we measure and check; and we expose and correct anyone who is non-conformant. We accept that is the price we must pay for a Perfect World … Yes? Unfortunately the answer is No. We are deluded. We are all habitual criminals. We are all guilty of committing a crime against humanity – the Crime of Metric Abuse. And we are blissfully ignorant of it so it comes as a big shock when we learn the reality of our unconscious complicity.

You might want to sit down for the next bit.

First we need to set the scene:
1. Sustained improvement requires actions that result in irreversible and beneficial changes to the structure and function of the system.
2. These actions require making wise decisions – effective decisions.
3. These actions require using resources well – efficient processes.
4. Making wise decisions requires that we use our system metrics correctly.
5. Understanding what correct use is means recognising incorrect use – abuse awareness.

When we commit the Crime of Metric Abuse, even unconsciously, we make poor decisions. If we act on those decisions we get an outcome that we do not intend and do not want – we make an error.  Unfortunately, more efficiency does not compensate for less effectiveness – if fact it makes it worse. Efficiency amplifies Effectiveness – “Doing the wrong thing right makes it wronger not righter” as Russell Ackoff succinctly puts it.  Paradoxically our inefficient and bureaucratic systems may be our only defence against our ineffective and potentially dangerous decision making – so before we strip out the bureaucracy and strive for efficiency we had better be sure we are making effective decisions and that means exposing and treating our nasty habit for Metric Abuse.

Metric Abuse manifests in many forms – and there are two that when combined create a particularly virulent addiction – Abuse of Ratios and Abuse of Targets. First let us talk about the Abuse of Ratios.

A ratio is one number divided by another – which sounds innocent enough – and ratios are very useful so what is the danger? The danger is that by combining two numbers to create one we throw away some information. This is not a good idea when making the best possible decision means squeezing every last drop of understanding our of our information. To unconsciously throw away useful information amounts to incompetence; to consciously throw away useful information is negligence because we could and should know better.

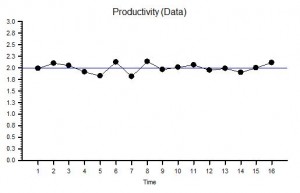
Here is a time-series chart of a process metric presented as a ratio. This is productivity – the ratio of an output to an input – and it shows that our productivity is stable over time.  We started OK and we finished OK and we congratulate ourselves for our good management – yes? Well, maybe and maybe not.  Suppose we are measuring the Quality of the output and the Cost of the input; then calculating our Value-For-Money productivity from the ratio; and then only share this derived metric. What if quality and cost are changing over time in the same direction and by the same rate? The productivity ratio will not change.


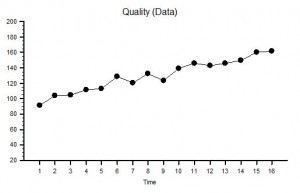
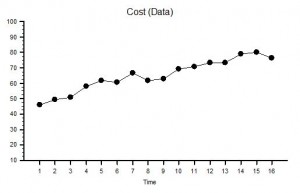
Suppose the raw data we used to calculate our ratio was as shown in the two charts of measured Ouput Quality and measured Input Cost  – we can see immediately that, although our ratio is telling us everything is stable, our system is actually changing over time – it is unstable and therefore it is unpredictable. Systems that are unstable have a nasty habit of finding barriers to further change and when they do they have a habit of crashing, suddenly, unpredictably and spectacularly. If you take your eyes of the white line when driving and drift off course you may suddenly discover a barrier – the crash barrier for example, or worse still an on-coming vehicle! The apparent stability indicated by a ratio is an illusion or rather a delusion. We delude ourselves that we are OK – in reality we may be on a collision course with catastrophe. 

But increasing quality is what we want surely? Yes – it is what we want – but at what cost? If we use the strategy of quality-by-inspection and add extra checking to detect errors and extra capacity to fix the errors we find then we will incur higher costs. This is the story that these Quality and Cost charts are showing.  To stay in business the extra cost must be passed on to our customers in the price we charge: and we have all been brainwashed from birth to expect to pay more for better quality. But what happens when the rising price hits our customers finanical constraint?  We are no longer able to afford the better quality so we settle for the lower quality but affordable alternative.  What happens then to the company that has invested in quality by inspection? It loses customers which means it loses revenue which is bad for its financial health – and to survive it starts cutting prices, cutting corners, cutting costs, cutting staff and eventually – cutting its own throat! The delusional productivity ratio has hidden the real problem until a sudden and unpredictable drop in revenue and profit provides a reality check – by which time it is too late. Of course if all our competitors are committing the same crime of metric abuse and suffering from the same delusion we may survive a bit longer in the toxic mediocrity swamp – but if a new competitor who is not deluded by ratios and who learns how to provide consistently higher quality at a consistently lower price – then we are in big trouble: our customers leave and our end is swift and without mercy. Competition cannot bring controlled improvement while the Abuse of Ratios remains rife and unchallenged.

Now let us talk about the second Metric Abuse, the Abuse of Targets.

The blue line on the Productivity chart is the Target Productivity. As leaders and managers we have bee brainwashed with the mantra that “you get what you measure” and with this belief we commit the crime of Target Abuse when we set an arbitrary target and use it to decide when to reward and when to punish. We compound our second crime when we connect our arbitrary target to our accounting clock and post periodic praise when we are above target and periodic pain when we are below. We magnify the crime if we have a quality-by-inspection strategy because we create an internal quality-cost tradeoff that generates conflict between our governance goal and our finance goal: the result is a festering and acrimonious stalemate. Our quality-by-inspection strategy paradoxically prevents improvement in productivity and we learn to accept the inevitable oscillation between good and bad and eventually may even convince ourselves that this is the best and the only way.  With this life-limiting-belief deeply embedded in our collective unconsciousness, the more enthusiastically this quality-by-inspection design is enforced the more fear, frustration and failures it generates – until trust is eroded to the point that when the system hits a problem – morale collapses, errors increase, checks are overwhelmed, rework capacity is swamped, quality slumps and costs escalate. Productivity nose-dives and both customers and staff jump into the lifeboats to avoid going down with the ship!  

The use of delusional ratios and arbitrary targets (DRATs) is a dangerous and addictive behaviour and should be made a criminal offense punishable by Law because it is both destructive and unnecessary.

With painful awareness of the problem a path to a solution starts to form:

1. Share the numerator, the denominator and the ratio data as time series charts.
2. Only put requirement specifications on the numerator and denominator charts.
3. Outlaw quality-by-inspection and replace with quality-by-design-and-improvement.  

Metric Abuse is a Crime. DRATs are a dangerous addiction. DRATs kill Motivation. DRATs Kill Organisations.

Charts created using BaseLine

The One-Eyed Man in the Land of the Blind.

“There are known knowns; there are things we know we know.
We also know there are known unknowns; that is to say we know there are some things we do not know.
But there are also unknown unknowns – the ones we don’t know we don’t know.” Donald Rumsfeld 2002

This infamous quotation is a humorously clumsy way of expressing a profound concept. This statement is about our collective ignorance – and it hides a beguiling assumption which is that we are all so similar that we just have to accept the things that we all do not know. It is OK to be collectively and blissfully ignorant. But is this OK? Is this not the self-justifying mantra of those who live in the Land of the Blind?

Our collective blissful ignorance holds the promise of great unknown gains; and harbours the potential of great untold pain.

Our collective knowledge is vast and is growing because we have dissolved many Unknowns.  For each there must have been a point in time when the first person become painfully aware of their ignorance and, by some means, discovered some new knowledge. When that happened they had a number of options – to keep it to themselves, to share it with those they knew, or to share it with strangers. The innovators dilemma is that when they share new knowledge they know they will cause emotional pain; because to share knowledge with the blissfully ignorant implies pushing them to the state of painful awareness.

We are social animals and we demonstrate empathy and respect for others, so we do not want to deliberately cause them emotional pain – even the short term pain of awareness that must preceed the long term gain of knowledge, understanding and wisdom. It is the constant challenge that every parent, every teacher, every coach, every mentor, every leader and every healer has to learn to master.

So, how do we deal with the situation when we are painfully aware that others are in the state of blissful ignorance – of not knowing what they do not know – and we know that making them aware will be emotionally painful for them – just as it was for us? We know from experience that that an insensitive, clumsy, blunt, brutal, just-tell-it-as-it is approach can cause pain-but-no-gain; we have all had experience of others who seem to gain a perverse pleasure from the emotional impact they generate by triggering painful awareness. The disrespectful “means-justifies-the-ends” and “cruel-to-be-kind” mindset is the mantra of those who do not walk their own talk – those who do not challenge their own blissful ignorance – those who do not seek to gain an understanding of how to foster effective learning without inflicting emotional pain.

The no-pain-no-gain life limiting belief is an excuse – not a barrier. It is possible to learn without pain – we have all been doing it for our whole lives; each of us can think of people who inspired us to learn and to have fun doing so – rare and memorable role models, bright stars in the darkness of disappointment. Our challenge is to learn how to inspire ourselves.

The first step is to create an emotionally Safe Environment for Learning and Fun (SELF). For the leader/teacher/healer this requires developing an ability to build a culture of trust by actively unlearning their own trust-corroding-behaviours.  

The second step is to know what we know – to be sure of our facts and confident that we can explain and support what we know with evidence and insight. To deliberately push someone into painful awareness with no means to guide them out of that dark place is disrespectful and untrustworthy behaviour. Learning how to teach what we know is the most effective means to discover our own depth of understanding and it is an energising exercise in humility development! 

The third step is for us to have the courage to raise awareness in a sensitive and respectful way – sometimes this is done by demonstrating the knowledge; sometimes this is done by asking carefully framed questions; and sometimes it is done as a respectful challenge.  The three approaches are not mutually exclusive: leading-by-example is effective but leaders need to be teachers and healers too.  

At all stages the challenge for the leader/teacher/healer is to to ensure they maintain an OK-OK mental model of those they influence. This is the most difficult skill to attain and is the most important. The “Leadership and Self-Deception” book that is in the Library of Improvement Science is a parable that decribes this challenge.

So, how do we dissolve the One-Eyed Man in the Land of the Blind problem? How do we raise awareness of a collective blissful ignorance? How do we share something that is going to cause untold pain and misery in the future – a storm that is building over the horizon of awareness.

Ignaz Semmelweis (1818-1865) was the young Hungarian doctor who in 1847 discovered the dramatic live-saving benefit of the doctors cleaning their hands before entering the obstetric ward of the Vienna Hospital. This was before “germs” had been discovered and Semmelweis could not explain how his discovery worked – all he could do was to exhort others to do as he did. He did not learn how the method worked, he did not publish his data, and he demonstrated trust-eroding behaviour when he accused others of “murder” when they did not do as he told them.  The fact the he was correct did not justify the means by which he challenged their collective blissful ignorance (see http://www.valuesystemdesign.com for a fuller account).  The book that he eventually published in 1861 includes the data that supports our modern understanding of the importance of hand hygiene – but it also includes a passionate diatribe of how he had been wronged by others – a dramatic example of the “I’m OK and The Rest of the World is Not OK” worldview. Semmelweis was committed to a lunatic asylum and died there in 1865.   

W Edwards Deming (1900-1993) was the American engineer, mathematician, mathematical physicist, statistician and student of Walter A. Shewhart who learned the importance of quality in design. After WWII he was part of the team who helped to rebuild the Japanese economy and he taught the Japanese what he had learned and practiced during WWII – which was how to create a high-quality, high-speed, high-efficiency process which, ironically, was building ships for the war effort. Later Deming attempted, and failed, to influence the post-war generation of managers that were being churned out by the new business schools to serve the growing global demand for American mass produced consumer goods. Deming returned to relative obscurity in the USA until 1980 when his teachings were rediscovered when Japan started to challenge the USA economically by producing higher-quality-and-lower-cost consumer products such as cars and electronics ( http://en.wikipedia.org/wiki/W._Edwards_Deming). Before he died in 1993 Deming wrote two books – Out of The Crisis and The New Economics in which he outlines his learning and his philosophy and in which he unreservedly and passionately blames the managers and the business schools that trained them for their arrogant attitude and disrespectful behaviour. Like Semmelweis, the fact that his books contain a deep well of wisdom does not justify the means by which he disseminated his criticism of poeple – in particular of senior management. By doing so he probably created resistance and delayed the spread of knowledge.  

History is repeating itself: the same story is being played out in the global healthcare system. Neither senior doctors nor senior managers are aware of the opportunity that the learning of Semmelweis and Deming represent – the opportunity of Improvement Science and of the theory, techniques and tools of Operations Management. The global healthcare system is in a state of collective blissful ignorance.  Our descendents be the recipients of of decisions and the judges of our behaviour – and time is running out – we do not have the luxury of learning by making the same mistake.

Fortunately, there is an growing group of people who are painfully aware of the problem and are voicing their concerns – such as the Institute of Healthcare Improvement  in America. There is a smaller and less well organised network of people who have acquired and applied some of the knowledge and are able to demonstrate how it works – the Know Hows. There appears to be an even smaller group who understand and use the principles but do it intuitively and unconsciously – they dem0nstrate what is possible but find it difficult to teach others how to do what they do. It is the Know How group that is the key to dissolving the problem.

The first collective challenge is to sign-post some safe paths from Collective Blissful Ignorance to Individual Know How. The second collective challenge is to learn an effective and respectful way to raise awareness of the problem – a way to outline the current reality and the future opportunity – and a way that illuminates the paths that link the two.

In the land of the blind the one-eyed man is the person who discovers that everyone is wearing a head-torch by accidentally finding his own and switching it on!


The Seven Flows

Improvement Science is the knowledge and experience required to improve … but to improve what?

Improve safety, delivery, quality, and productivity?

Yes – ultimately – but they are the outputs. What has to be improved to achieve these improved outputs? That is a much more interesting question.

The simple answer is “flow”. But flow of what? That is an even better question!

Let us consider a real example. Suppose we want to improve the safety, quality, delivery and productivity of our healthcare system – which we do – what “flows” do we need to consider?

The flow of patients is the obvious one – the observable, tangible flow of people with health issues who arrive and leave healthcare facilities such as GP practices, outpatient departments, wards, theatres, accident units, nursing homes, chemists, etc.

What other flows?

Healthcare is a service with an intangible product that is produced and consumed at the same time – and in for those reasons it is very different from manufacturing. The interaction between the patients and the carers is where the value is added and this implies that “flow of carers” is critical too. Carers are people – no one had yet invented a machine that cares.

As soon as we have two flows that interact we have a new consideration – how do we ensure that they are coordinated so that they are able to interact at the same place, same time, in the right way and is the right amount?

The flows are linked – they are interdependent – we have a system of flows and we cannot just focus on one flow or ignore the inter-dependencies. OK, so far so good. What other flows do we need to consider?

Healthcare is a problem-solving process and it is reliant on data – so the flow of data is essential – some of this is clinical data and related to the practice of care, and some of it is operational data and related to the process of care. Data flow supports the patient and carer flows.

What else?

Solving problems has two stages – making decisions and taking actions – in healthcare the decision is called diagnosis and the action is called treatment. Both may involve the use of materials (e.g. consumables, paper, sheets, drugs, dressings, food, etc) and equipment (e.g. beds, CT scanners, instruments, waste bins etc). The provision of materials and equipment are flows that require data and people to support and coordinate as well.

So far we have flows of patients, people, data, materials and equipment and all the flows are interconnected. This is getting complicated!

Anything else?

The work has to be done in a suitable environment so the buildings and estate need to be provided. This may not seem like a flow but it is – it just has a longer time scale and is more jerky than the other flows – planning-building-using a new hospital has a time span of decades.

Are we finished yet? Is anything needed to support the these flows?

Yes – the flow that links them all is money. Money flowing in is called revenue and investment and money flowing out is called costs and dividends and so long as revenue equals or exceeds costs over the long term the system can function. Money is like energy – work only happens when it is flowing – and if the money doesn’t flow to the right part at the right time and in the right amount then the performance of the whole system can suffer – because all the parts and flows are interdependent.

So, we have Seven Flows – Patients, People, Data, Materials, Equipment, Estate and Money – and when considering any process or system improvement we must remain mindful of all Seven because they are interdependent.

And that is a challenge for us because our caveman brains are not designed to solve seven-dimensional time-dependent problems! We are OK with one dimension, struggle with two, really struggle with three and that is about it. We have to face the reality that we cannot do this in our heads – we need assistance – we need tools to help us handle the Seven Flows simultaneously.

Fortunately these tools exist – so we just need to learn how to use them – and that is what Improvement Science is all about.

Ignorance Mining

Ignorance means “not knowing” and as the saying goes “Ignorance is bliss” because we do not worry about what we do not know about.  Or do we?

We are not totally ignorant – because we know that there are “unknowns” that would be of value to us. This knowledge creates an anxiety that we are very good at pushing out of awareness and despite the denial the unconscious feeling remains and it is emotionally corrosive. Repressed anxiety leads to the counter-productive behaviour of self-deception and then to self-justification – both of which are potent impedients to improvement.

We habitually, continuously and unconsciously discount the importance of what we do not know and in so doing we create internal emotional dissonance.  Our inner conflict drives external discounting behaviour and the inevitable toxic cultural consequence – Erosion of Trust.  Our inner conflict also drives internal discounting behaviour and the inevitable toxic emotional consequence – Erosion of  Confidence. This is the toxic emotional waste swamp that we create for ourselves and is the slippery slope that leads down to frustration, depression, cynicism and apathy. Ignorance  leads to anxiety and fear – and because we have conditioned ourselves to back away from fear we reflexly back away from ignorance and we end up trading fear for frustration. We do it to ourselves first and then we do it to others.

The antidote is counter-intuitive: it is to actively acknowledge and embrace our ignorance – and to do that we have to deliberately expose our own ignorance because we are very, very good at burying it from conscious view under a mountain of self-deception and self-justification.  We need to become Ignorace Miners.

The opposite of ignorance if knowledge and the good news is that we only need to scratch the surface to find knowledge nuggets – not huge ones perhaps – but plentiful. A bag of small knowledge nuggets is as valuable as an ingot of insight!

Knowledge nuggets are durable because they withstand cultural erosion but they can get washed away in the flood of toxic emotional waste and they can get buried under layers of cynical-resentful-arrogant-pessimism (CRAP).  These knowledge nuggests need to be re-gathered, re-freshed and re-cycled – and it is an endlessly exciting and energising experience.

So, when we are feeling fustrated, demotivated and depressed we just need to give ourselves a break and indulge in a bit of gentle ignorance mining – and when we do we will start to feel better immediately.

JIT, WIP, LIP and PIP

It is a fantastic feeling when a piece of the jigsaw falls into place and suddenly an important part of the bigger picture emerges. Feelings of confusion, anxiety and threat dissipate and are replaced by a sense of insight, calm and opportunitity.

Improvement Science is about 80% subjective and 20% objective: more cultural than technical – but the technical parts are necessary. Processes obey the Laws of Physics – and unlike the Laws of People these not open to appeal or repeal. So when an essential piece of process physics is missing the picture is incomplete and confusion reigns.

One piece of the process physics jigsaw is JIT (Just-In-Time) and process improvement zealots rant on about JIT as if it were some sort of Holy Grail of Improvement Science.  JIT means what you need arrives just when you need it – which implies that there is no waiting of it-for-you or you-for-it.  JIT is an important output of an improved process; it is not an input!  The danger of confusing output with input is that we may then try to use delivery time as a mangement metric rather than a performance metric – and if we do that we get ourselves into a lot of trouble. Delivery time targets are often set and enforced and to a large extent fail to achieve their intention because of this confusion.  To understand how to achieve JIT requires more pieces of the process physics jigsaw. The piece that goes next to JIT is labelled WIP (Work In Progress) which is the number of jobs that are somewhere between starting and finishing.  JIT is achieved when WIP is low enough to provide the process with just the right amount of resilience to absorb inevitable variation; and WIP is a more useful management metric than JIT for many reasons (which for brevity I will not explain here). Monitoring WIP enables a process manager to become more proactive because changes in WIP can signal a future problem with JIT – giving enough warning to do something.  However, although JIT and WIP are necessary they are not sufficient – we need a third piece of the jigsaw to allow us to design our process to deliver the JIT performance we want.  This third piece is called LIP (Load-In-Progress) and is the parameter needed to plan and schedule  the right capacity at the right place and the right time to achieve the required WIP and JIT.  Together these three pieces provide the stepping stones on the path to Productivity Improvement Planning (PIP) that is the combination of QI (Quality Improvement) and CI (Cost Improvement).

So if we want our PIP then we need to know our LIP and WIP to get the JIT.  Reddit? Geddit?         

Do You Have A Miserable Job?

If you feel miserable at work and do not know what to do then then take heart because you could be suffering from a treatable organisational disease called CRAP (cynically resistant arrogant pessimism).

To achieve a healthier work-life then it is useful to understand the root cause of CRAP and the rationale of how to diagnose and treat it.

Organisations have three interdependent dimensions of performance: value, time and money.  All organisations require both the people and the processes to be working in synergy to reliably deliver value-for-money over time.  To create a productive system it is necessary to understand the relationships between  value, money and time. Money is easier because it is tangible and durable; value is harder because it is intangible and transient. This means that the focus of attention is usually on the money – and it is often assumed that if the money is OK then the value must be OK too.  This assumption is incorrect.

Value and money are interdependent but have different “rates of change”  and can operate in different “directions”.  A common example is when a dip in financial performance triggers an urgent “drive” to improve the “bottom line”.  Reactive revenue generation and cost cutting results in a small, quick, and tangible improvement on the money dimension but at the same time sets off a large, slow, and intangible deterioration on the value dimension.  Money, time and  value are interdependent and the inevitable outcome is a later and larger deterioration in the money – as illustrated in the doodle. If only money is measured the deteriorating value is not detected, and by the time the money starts to falter the momentum of the falling value is so great that even heroic efforts to recover are futile. As the money starts to fall the value falls even further and even faster – the lose-lose-lose spiral of organisational failure is now underway.

People who demonstrate in their attitude and behaviour that they are miserable at work provide the cardinal sign of falling system value. A miserable, sceptical and cynical employee poisons the emotional atmosphere for everyone around them. Misery is both defective and infective.  The primary cause of a miserable job is the behaviour exhibited by people in positions of authority – and the more the focus is only on money the more misery their behaviour generates.

Fortunately there is an antidote; a way to break out of the vicious tail spin – measure both value and money, focus on improving value and observe the positive effect on the money.  The critical behaviour is to actively test the emotional temperature and to take action to keep it moving in a positive direction.  “The Three Signs of a Miserable Job” by Patrick Lencioni tells a story of how an experienced executive learns that the three things a successful managerial leader must do to achieve system health are:
1) ensure employees know their unique place, role and value in the whole system;
2) ensure employees can consciously connect their work with a worthwhile system goal; and
3) ensure employees can objectively measure how they are doing.

Miserable jobs are those where the people feel anonymous, where people feel their work is valueless, and where people feel that they get no feedback from their seniors, peers or juniors. And it does not matter if it is the cleaner or the chief executive – everyone needs a role, a goal and to know all their interdependencies.

We do not have to endure a Miserable Job – we all have the power to transform it into Worthwhile Work.

Sentenced to Death-by-Meeting!

Do you ever feel a sense of dread when you are summoned to an urgent meeting; or when you get the minutes and agenda the day before your monthly team meeting; or when you see your diary full of meetings for weeks in advance – like a slow and painful punishment?

If so then you may have unwittingly sentenced yourself to Death by Meeting.  What?  We do it to ourselves? No way! That would be madness!

But think about it. We consciously and deliberately ingest all sorts of other toxins: chemicals like caffeine, alcohol and cigarette smoke – so what is so different about immersing ourselves in the emotional toxic waste that many meetings seem to generate?

Perhaps we have learned to believe that there is no other way and because we have never experienced focussed, fun, and effective meetings where problems are surfaced, shared and solved quickly – problems that thwart us as individuals. Meetings where the problem-solving sum is greater than the problem-accumulating parts.

A meeting is a system that is designed to solve  problems.  We can improve our system incrementally but it is a slow process; to achieve a breakthrough we need to radically redesign the system.  There are three steps to doing this:

1. First decide what sort of problems the meeting is required to solve: strategic, operational or tactical;
2. Second design, test and practice a problem solving process for each category of problem; and
3. Third, select the appropriate tool for the task.

In his illuminating book Death by Meeting, Patrick Lencioni describes three meeting designs and illustrates with a story why meetings don’t work if the wrong tool is used for the wrong task. It is a sobering story.

There is another dimension to the design of meetings; that is how we solve problems as groups – and how, as a group, we seem to waste a lot of effort and time in unproductive discussion.  In his book Six Thinking Hats Edward De Bono provides an explanation for our habitual behaviour and a design for a radically different group problem solving process – one that a group would not arrive at by evolution – but one that has been proven to work.

If  we feel sentenced to death-by-meetings then we could buy and read these two small books – a zero-risk, one-off investment of effort, time and money for a guaranteed regular reward of fun, free time and success!

So if I complain to myself and others about pointless meetings and I have not bothered to do something about it myself then I now know that it is I who sentenced myself to Death-by-Meeting. Unintentionally and unconsciously perhaps – but me nevertheless.

The Six Learning Pebbles

Yesterday I had the great pleasure of taking Alice and Sophie to school. When I am doing the school run we often play a game of “interesting conversations” and we talked about what were were planning to do today.  “I am going to demonstrate the Six Thinking Hats method of solving problems” I said and gave a thumbnail sketch of Edward De Bono’s inspired invention. “That sounds like our Six Pebbles of Learning that we learned in SEAL” said Alice. “What is SEAL”?  I asked. “Social and Emotional Aspects of Learning” she replied “it is one of our lessons”.  My curiosity was pricked. “Wow! And what are the Six Pebbles? ” I asked.  Alice reeled them off immediately “Watching, Asking, Listening, Thinking Carefully, Perseverence and Learning from Mistakes”.  I was speechless – they didn’t teach that stuff when I was at school!  There are many organisations that invest small fortunes on “Team Development Programmes” which sounded to me like the same stuff – schools seem to have moved on a bit!

So, after a thoroughly enjoyable afternoon juggling the Six Hats I looked up the Six Pebbles on the Internet and here is what I found …
              
One stormy night, far, far away, a woman gave birth to four healthy sons. She wrapped them up and laid them in a row next to her. What would happen to them? She prayed to the magic spirit of her family. There was a flash and a beautiful spirit appeared. The spirit looked at the first baby. Out of her golden bag she drew a shiny purple stone and sang, ‘You will be a talented musician.’ To the second baby she gave a green stone and sang, ‘You will be a fantastic farmer.’ To the third baby she gave a red stone and sang, ‘You will be a talented artist.’ When she came to the fourth baby, she drew out of her bag six ugly brown pebbles. ‘And you will be a good learner’, she sang. There was a fearful bang and a flash of light and the spirit disappeared.

What did she mean?’ the woman asked herself. She looked at the pebbles. ‘It can’t be very important’, she thought. Even so she carefully put the pebbles in a small bag and hung them round the baby’s neck.

As soon as the first three sons could walk they showed their talents. People always asked to hear the first son sing. If one of their animals was sick, they brought it to the second son and he immediately knew what was wrong. The third son drew pictures so beautiful that when he was still young people asked him to decorate their houses and clothes. When the woman looked at the fourth son she kissed him on the forehead and smiled, and thought that it was a good job he had such talented brothers.The fourth son looked at the six pebbles and wondered what they meant. He was very proud of his three brothers. He wanted to be like them, so he looked carefully at what they did. He asked them questions and listened carefully to what they said. He thought about what he saw and heard. He imitated what they did and when it didn’t work he didn’t give up, but learned from it. The brothers loved him dearly and, because he was so helpful and good to be with, they spent lots of time with him. When the four sons were nearly grown up the woman said to the first three sons, ‘Go off and make your fortunes. You have all the talents you need.’ They left the farm. The fourth son asked if he could go too but the woman said, ‘You haven’t any special talents so perhaps you had better stay here. What have you got to offer the world?’

That evening she was feeling sad. ‘I wish someone was here to cheer me up,’ she said. The fourth son opened his mouth and sang a song. It was beautiful – as beautiful as the songs of the first son. The next day one of the animals was sick. The fourth son looked at the animal and knew what to do. The next day it was better, just like the animals that the second son had looked after. When the woman woke up the next day she saw a lovely new picture on the wall, as beautiful as the pictures painted by the third son.

She took the small bag from round fourth son’s neck and looked at them. She remembered what the spirit had said: ’And you will be a good learner.’

The Rubik Cube Problem

Look what popped out of Santa’s sack!

I have not seen one of these for years and it brought back memories of hours of frustration and time wasted in attempting to solve it myself; a sense of failure when I could not; a feeling of envy for those who knew how to; and a sense of indignation when they jealously guarded the secret of their “magical” power.

The Rubik Cube got me thinking – what sort of problem is this?

At first it is easy enough but it becomes quickly apparent that it becomes more difficult the closer we get to the final solution – because our attempts to reach perfection undo our previous good work.  It is very difficult to maintain our initial improvement while exploring new options. 

This insight struck me as very similar to many of the problems we face in life and the sense of futility that creates a powerful force that resists further attempts at change.  Fortunately, we know that it is possible to solve the Rubik cube – so the question this raises is “Is there a way to solve it in a rational, reliable and economical way from any starting point?

One approach is to try every possible combination of moves until we find the solution. That is the way a computer might be programmed to solve it – the zero intelligence or brute force approach.

The problem here is that it works in theory but fails in practice because of the number of possible combinations of moves. At each step you can move one of the six faces in one of two directions – that is 12 possible options; and for each of these there are 12 second moves or 12 x 12 possible two-move paths; 12 x 12 x 12 = 1728 possible three-move paths; about 3 million six-move paths; and nearly half a billion eight-move paths!

You get the idea – solving it this way is not feasible unless you are already very close to the solution.

So how do we actually solve the Rubik Cube?  Well, the instructions that come with a new one tells you – a combination of two well-known ingredients: strategy and tactics. The strategy is called goal-directed and in my instructions the recommended strategy is to solving each layer in sequence. The tactics are called heuristics: tried-tested-and-learned sequences of actions that are triggered by specific patterns.

At each step we look for a small set of patterns and when we find one we follow the pre-designed heuristic and that moves us forward along the path towards the next goal. Of the billions of possible heuristics we only learn, remember, use and teach the small number that preserve the progress we have already made – these are our magic spells.

So where do these heuristics come from?

Well, we can search for them ourselves or we can learn them from someone else.  The first option holds the opportunity for new insights and possible breakthroughs – the second option is quicker!  Someone who designs or discovers a better heuristic is assured a place in history – most of us only ever learn ones that have been discovered or taught by others – it is a much quicker way to solve problems.  

So, for a bit of fun I compared the two approaches using a computer: the competitive-zero-intelligence-brute-force versus the collaborative-goal-directed-learned-and-shared-heuristics.  The heuristic method won easily every time!

The Rubik Cube is an example of a mechanical system: each of the twenty-six parts are interdependent, we cannot move one facet independently of the others, we can only move groups of nine at a time. Every action we make has nine consequences – not just one.  To solve the whole Rubik Cube system problem we must be mindful of the interdependencies and adopt methods that preserve what works while improving what does not.

The human body is a complex biological system. In medicine we have a phrase for this concept of preserving what works while improving what does not: “primum non nocere” which means “first of all do no harm”.  Doctors are masters of goal-directed heuristics; the medical model of diagnosis before prognosis before treatment is a goal-directed strategy and the common tactic is to quickly and accurately pattern-match from a small set of carefully selected data. 

In reality we all employ goal-directed-heuristics all of the time – it is the way our caveman brains have evolved.  Relative success comes from having a more useful set of heuristics – and these can be learned.  Just as with the Rubik Cube – it is quicker to learn what works from someone who can demonstrate that it works and can explain how it works – than to always laboriously work it out for ourselves.

An organisation is a bio-psycho-socio-economic system: a set of interdependent parts called people connected together by relationships and communication processes we call culture.  Improvement Science is a set of heuristics that have been discovered or designed to guide us safely and reliably towards any goal we choose to select – preserving what has been shown to work and challenging what does not.  Improvement Science does not define the path it only helps us avoid getting stuck, or going around in circles, or getting hopelessly lost while we are on the life-journey to our chosen goal.

And Improvement Science is learnable.

Inborn Errors of Management

There is a group of diseases called “inborn errors of metabolism” which are caused by a faulty or missing piece of DNA – the blueprint of life that we inherit from our parents. DNA is the chemical memory that stores the string of instructions for how to build every living organism – humans included. If just one DNA instruction becomes damaged or missing then we may lose the ability to make or to remove one specific chemical – and that can lead to a deficiency or an excess of other chemicals – which can then lead to dysfunction – which can then make us feel unwell – and can then limit both our quality and quantity of life.  We are a biological system of interdependent parts. If an inborn error of metabolism is lethal it will not be passed on to our offspring because we don’t live long enough – so the ones we see are the ones which and not lethal.  We treat the symptoms of an inborn error of metabolism by artificially replacing the missing chemical – but the way to treat the cause is to repair, replace or remove the faulty DNA.

The same metaphor can be applied to any social system. It too has a form of DNA which is called culture – the inherited set of knowledge, beliefs, attitudes and behaviours that the organisation uses to conduct itself in its day-to-day business of survival. These patterns of behaviour are called memes – the social equivalent to genes – and are passed on from generation to generation through language – body language and symbolic language; spoken words – stories, legends, myths, songs, poems and books – the cultural collective memory of the human bio-psycho-social system. All human organisations share a large number of common memes – just as we share a large number of common genes with other animals and plants and even bacteria. Despite this much larger common cultural heritage – it is the differences rather than the similarities that we notice – and it is these differences that spawn the cultural conflict that we observe at all levels of society.

If, by chance alone, an organisation inherits a depleted set of memes it will appear different to all the others and it will tend to defend that difference rather than to change it. If an organisation has a meme defect, a cultural mutation that affects a management process, then we have the organisational condition called an Inborn Error of Management – and so long as the mutation is not lethal to the organisation it will tend to persist and be passed largely unnoticed from one generation of managers to the next!

The NHS was born in 1948 without a professional management arm, and while it survived and grew initally, it became gradually apparent that the omisson of the professional management limb was a problem; so in the 1980’s, following the Griffiths Report, a large dose professional management was grafted on and a dose of new management memes were injected. These included finance, legal and human resource management memes but one important meme was accidentally omitted – process engineering – the ability to design a process to meet a specific quality, time and cost specification.  This omission was not noticed initially because the rapid development of new medical technologies and new treatments was delivering improvements that obscured the inborn error of management. The NHS became the envy of many other countries – high quality healthcare available to all and free at the point of delivery.  Population longevity improved, public expectation increased, demand for healthcare increased and inevitably the costs increased.  In the 1990’s the growing pains of the burgeoning NHS led to a call for more funding, quoting other countries as evidence, and at the turn of the New Millenium a ten year plan to pump billions of pounds per year into the NHS was hatched.  Unfortunately, the other healthcare services had inherited the same meme defect – so the NHS grew 40% bigger but no better – and the evidence is now accumulatung that productivity (the ratio of output quality to input cost) has actally fallen by more than 10% – there are more people doing more work but less well.  The UK along with many other countries has hit an economic brick wall and the money being sucked into the NHS cannot increase any more – even though we have created a legacy of an increasing proportion of retired and elderly members of society to support. 

The meme defect that the NHS inherited in 1948 and that was not corrected in the transplant operation  1980’s is now exerting it’s influence – the NHS has no capability for process engineering – the theory, techniques, tools and training required to design processes are not on the curriculum of either the NHS managers or the clinicians. The effect of this defect is that we can only treat the symptoms rather than the cause – and we only have blunt and ineffective instruments such as a budget restriction – the management equivalent of a straight jacket – and budget cuts – the management equivalent of a jar of leeches. To illustrate the scale of the effect of this inborn error of management we only need to look at other organisations that do not appear to suffer from the same condition – for example the electronics manufacturing industry. The almost unbelieveable increase in the performance, quality and value for money of modern electronics over the last decade (mobile phones, digital cameras, portable music players, laptop computers, etc) is because these industries have invested in developing both their electrical and process engineering capabilities. The Law of the Jungle has weeded out the companies who did not – they have gone out of business or been absorbed – but publically funded service organisations like the NHS do not have this survival pressure – they are protected from it – and trying to simulate competition with an artificial internal market and applying stick-and-carrot top-down target-driven management is not a like-for-like replacement.    

The challenge for the NHS is clear – if we want to continue to enjoy high quality health care, free at the point of delivery, and that we can afford then we will need to recognise and correct our inborn error of management. If we ignore the symptoms, deny the diagnosis and refuse to take the medicine then we will suffer a painful and lingering decline – not lethal and not enjoyable – and it is has a name: purgatory.

The good news is that the treatment is neither expensive, nor unpleasant nor dangerous – process engineering is easy to learn, quick to apply, and delivers results almost immediately – and it can be incorporated into the organisational meme-pool quite quickly by using the see-do-teach vector. All we have to do is to own up to the symptoms, consider the evidence, accept the diagnosis, recognise the challenge and take our medicine. The sooner the better!


The Drama Triangle

Have you ever had the experience of trying to help someone with a problem, not succeeding, and being left with a sense of irritation, disappointment, frustration and even anger?

Was the dialog that led up to this unhappy outcome something along the lines of:

A: I have a problem with …
B: What about trying …
A: Yes, but ….
B: What about trying ….
A: Yes, but …

… and so on until you run out of ideas, patience or both.

If this sounds familiar then it is likely that you have been unwittingly sucked into a Drama Triangle – an unconscious, habitual pattern of behaviour that we all use to some degree.

This endemic behaviour has a hidden purpose: to feed our belonging need for social interaction.

The theory goes something like this – we are social animals and we need social interaction just as much as we need oxygen, water and food.  Without it we become psychologically malnourished and this insight explains why prolonged solitary confinement is such an effective punishment – it is the psychological equivalent to starvation.

The emotional sustenance we want most is unconditional love (UCL) – the sort we usually get from our parents, family and close friends.  Repeated affirmation that we are ‘OK’ with no strings attached.

The downside of our unconscious desire for UCL is that it offers a way for others to control our behaviour and those who choose to abuse that power are termed ‘manipulative’.  This control is done by adding conditions: “I will give you the affirmation you crave IF you do what I want“.  This is conditional love (CL).

When we are born we are completely powerless, and completely dependent on our parents – in particular our mother.  As we get older and start to exert our free will we learn that our society has rules – we cannot just follow every selfish desire.

Our parents unconsciously employ CL as a form of behavioural control and it is surprisingly effective: “If you are a good boy/girl then …“.  So, as children, we learn the technique from our parents.

This in itself  is not a problem; but it can become a problem when CL is the only sort available and when the intention is to further only the interests of the giver.  When this happens it becomes … manipulation.

The apparently harmless playground threat of “If you don’t do what I want then I won’t be your friend anymore” is the practice script of a future manipulator – and it feeds on a limiting-belief in the unconscious mind of the child – the belief that there is a limited supply of UCL and that someone else controls it.

And because we make this assumption at the pre-verbal stage of child development, it becomes unconscious, habitual, unspoken and second nature.


Our invalid childhood belief has a knock-on effect; we learn to survive on CL because “No Love” is the worst of all options; it is the psychological equivalent of starvation.

And we learn to put up with second best, and because CL offers inferior emotional nourishment we need a way of generating as much as we want, on-demand.

So we employ the behaviour we were unwittingly taught by our patents – and the Drama Triangle becomes our on-demand-generator-of-second-rate-emotional-sustenance.

The tangible evidence of this “programming” is an observable behaviour that is called “game playing” and was first described by Eric Berne in the famous book “Games People Play“.

Berne described many different Games and they all have a common pattern and a common objective – to generate second-rate emotional food (or ‘transactions’ to use Berne’s language).  But our harvest comes at a price – the transactions are unhealthy – not enough to harm us immediately – but enough to leave us feeling dissatisfied and unhappy.

But what choice do we believe we have?

If we were given the options of breathing stale air or suffocating what would we do?

If we assume our options are to die of thirst or drink stagnant pond-water what would we do?

If we believe our only options are to starve or eat rubbish what would we do?

Our survival instinct is much stronger than our belonging need, so we choose unhealthy over deadly and eventually we become so habituated to game-playing that we do not notice it any more.

Excessive and prolonged exposure to the Drama Triangle is the psychological equivalent of alcoholic liver cirrhosis.  Permanent and irreversible psychological scarring called cynicism.


It is important to remember that this is learned behaviour – and therefore it can be unlearned – or rather overwritten with a healthier habit.

Just by becoming aware of the problem, and understanding the root cause of the Drama Triangle, an alternative pathway appears.

We can challenge our untested assumption that UCL is limited and that someone else controls the supply.  We can consider the alternative hypothesis: that the supply of UCL is unlimited and that we control the supply.

Q: How easy is it for us to offer someone else UCL?

Easy – we see it all the time. How do you feel when someone gives a genuine “Thank You”, cheers you on, celebrates your success, seeks your opinion, and recommends you to others – with no strings attached.  These are all forms of UCL that anyone can practice; by making a conscious choice to give with no expectation of a return.

For many people it feels uncomfortable at first because the game-playing behaviour is so deeply ingrained – and game-playing is particularly prevalent in the corridors of power where it is called “politics”.

Game-free behaviour gets easier with practice because UCL benefits both the giver and the receiver – it feels healthier – there is no need for a payback, there is no score to be kept, no emotional account to balance.  It feels like a breath of fresh air.


So, next time you feel that brief flash of irritation at the start of a conversation or are left with a negative feeling after a conversation just stop and ask yourself  “Was I just sucked into a Drama Triangle?”

Anyone who is able to “press your button” is hooking you into a game, and it takes two to play.

Now consider the question “And to what extent was I unconsciously colluding?


The tactic to avoid the Drama Triangle is to learn to sense the emotional “hook” that signals the invitation to play the Game; and to consciously deflect it before it embeds into your unconscious mind and triggers an unconscious, habitual, reflex, emotional reaction.

One of the most potent barriers to change is when we unconsciously compute that our previously reliable sources of CL are threatened by the change.  We have no choice but to oppose the change – and that choice is made unconsciously. So, we unwittingly undermine the plan.

The symptoms of this unconscious behaviour are obvious when you know what to look for … and the commonest reaction is:

“Yes … but …”

and the more intelligent and invested the person the more cogent and rational the argument will sound.

The most effective response is to provide evidence that disproves the defensive assertion – not the person’s opinion – and before taking on this challenge we need to prepare the evidence.

By demonstrating that their game-playing behaviour no longer leads to the expected payoff, and at the same time demonstrating that game-free behaviour is both possible and better – we demonstrate that the underlying, unconscious, limiting belief is invalid.

And by that route we develop our capability for game-free social interactions.

Simple enough in theory, and it does works in practice, though it can be difficult to learn because game-playing is such an ingrained behaviour.  It does get easier with practice and the ultimate reward is worth the investment  – a healthier emotional environment.  And that is transformational.

Must We Unlearn First?

In the famous “Star Wars” films when Luke Skywalker is learning to master the Force – his trainer, Jedi Master Yoda, says the famous line:

You must unlearn what you have learned“.

These seven words capture a fundamental principle of Improvement Science – that very often we have to unlearn before we can improve.

Unlearning is not the same as forgetting – because much of what we have learned is unconscious – so to unlearn we first have to make our assumptions conscious.

Unlearning is not just erasing a memory, it is preparing the mental ground to replace the learning with something else.
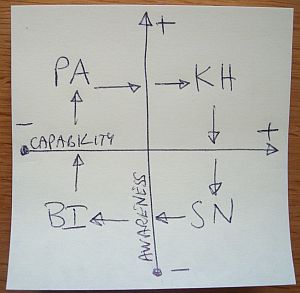
And we do not want to unlearn everything – we want to keep the nexus of knowledge nuggets that form the solid foundation of new learning.  We only want to unlearn what is preventing us adding new understanding, concepts and skills – the invisible layer of psychological grease that smears our vision and leaves our minds slippery and unable to grasp new concepts.

We need to apply some cognitive detergent and ad some heated debate to strip off the psycho-slime.  The best detergent is I have found is called Reality and the good news is that Reality is widely available, completely free and supplies will never run out.

Watch the video on YouTube

Will the Cuts Cure the Problem or Kill the Patient?

Times are hard. Severe austerity measures are being imposed to plug the hole in the national finances. Cuts are being made.  But will these cuts cure the problem or kill the patient?  How would we know before it is too late? Is there an alternative to sticking the fiscal knife in and hoping we don’t damage a vital part of the system? Is a single bold slash or a series of planned incisions a better strategy?  How deep, how far and how fast is it safe to cut? The answer to these questions is “we don’t know” – or rather that we find it very hard to predict with confidence what will happen.  The reason for this is that we are dealing with a complex system of interdependent parts that connect to each other through causal links; some links are accelerators, some are brakes, some work faster and some slower.  Our caveman brains were not designed to solve this sort of predicting-the-future-behaviour-of-a-complex-system problem: our brains evolved to spot potential danger quickly and to manage a network of social relationships.  So to our caveman way of thinking complex systems behave in counter-intuitive ways.  However, all physical systems are constrained by the Laws of Nature – so if we don’t understand how they behave then the limitation is with the caveman wetware between our ears.

We do have an amazing skill though – we have the ability to develop tools that extend our limited biological capabilites. We have mastered technology – in particular the technology of data and information. We have  learned how to recode and record our expereince and our understanding so that each generation can build on the knowledge of the previous ones.  The tricky problems we are facing are ones that we have never encountered before so we have to learn as we go.

So our current problem of understanding the dynamics of our economic and social system is this: we cannot do this unconsciously and intuitively in our heads. Instead we have developed tools that can extend our predictive capability. Our challenge is to learn how to use these tools – how to wield the fiscal scalpel so that it is quick, safe and effective. We need to excise the cancer of waste while preserving our vital social and economic structures and processes.  We need the best tools available – diagnostic tools, decision tools, treatment planning tools, and progress monitoring tools.  These tools exist – we just need to learn to use them.

A perfect example of this is the reining in of public spending and the impact of cutting social service budgets.  One thing that these budgets provide are services that some people need to maintain independent living in the community.  Very often elderly people are only just coping and even a minor illness can be enough to tip them over the edge and into hospital – where they can get stuck because to discharge them safely requires extra social support – support that if provided earlier might have prevented a hospital admission. So boldly slashing the social care budget will not magically excise the waste – it means that there will be less social support capacity and patients will get stuck in the hospital part of the health and social care system. This is not good for them – or anyone else. Hospitals are not hotels and getting stuck in one is not a holiday! Hospitals are for people who are very ill – and if the hospital is full of not-so-ill people who are stuck then we have an even bigger problem – because the very ill people get even more ill – and then they need even more resources to get them well again. Some do not make it. A bold slash in just one part of the health and  social care system can, unintentionally, bring the whole health and social care system crashing down.

Fortunately there is a way to avoid this – and it is counter-intuitive – otherwise we would have done it already. And because it is counter-intuitive I cannot just explain it – the only way to understand it is to discover and demonstrate  it to ourselves.  And in the process of learning to master the tools we need we will make a lot of errors. Clearly, we do not want to impose those errors on the real system – so we need something to practice with that is not the real system yet behaves realistically enough to allow us to develop our skills. That something is a system simulation. To experience an example of a healthcare system simulation and to play the game please follow the link: click here to play the game

What do We Mean by Capacity?

I often hear the statement “Our problem is caused by lack of capacity?” and this is usually followed by a heated debate (i.e. an arugment) about how to get more resources to solve the “capacity problem”: The protagonists are usually Governance who start the debate by raising a safety or quality problem; Operations who are tasked to resolve the problem and Finance who are expected to pay.

But what are they talking about? What exactly is “Capacity”? The reason I ask is because the word is ambiguous – it has several meanings – and unless the precise meaning is made explicit then individuals may unconsciously assume different interpretations and crossed-wires, confusion and conflict will ensue.

From the perspective of a process there are at least two distinct meanings that must not be confused: one is flow capacity and the other is inventory capacity.  To give an example of the distinction consider your household plumbing system: the hot water tank has a capacity that is measured in the volume of the tank – e.g. in litres; the pipe that leads from the tank to your tap has a capacity that is measured by the flow through the pipe – e.g. in litres per minute.  These are clearly NOT the same; they are related by time: A 50 litre capacity tank connected to a 5 litre per minute capacity pipe will empty in 10 minutes. So when you are talking about “capacity” be sure to be explicit about which form you mean … volume or flow; static or dynamic; inventory or activity.  It will avoid a LOT of confusion!!

Is this Second Nature or Blissful Ignorance?

Four stages of learningI haven’t done a Post-It doodle for a while so here is one of my favourites that I was reminded of this week.  Recently my organisation has mandated that we complete a 360-feedback exercise – which for me generated some anxiety – even fear. Why? What am I scared of? Could it be that I am unconsciously aware that there are things I am not very good – I just don’t know what they are – and by asking for feedback I will become painfully aware of my limitations? What then? Will I able to address those weaknesses or do I have to live with them? And even more painful to consider; what if I believed I was good at something because I have been doing it so long it has become second nature – and I discover that what I was good at is not longer appropriate or needed? Wow! That is not going to feel much fun.  I think I’ll avoid the whole process by keeping too busy to complete the online questionnaire.  That strategy did not work of course – a head-in-the-sand approach often doesn’t.  So I completed it and await my fate with trepidation.

The model of learning that I have sketched is called the Conscious-Competence model or – as I prefer to call it – Capability Awareness.  We all start bottom left – not aware of our lack of capablity – let’s call that Blissful Ignorance.  Then something happens that challenges our complacency – we become aware of our lack of capability – ouch! That is Painful Awareness.  From there we have three choices – retreat (denial), stay where we are (distress) or move forward (discovery).  If we choose the path of discovery we must actively invest time and effort to develop our capability to get to the top right position – where we are aware of what we can do – the state of Know How.  Then as we practice or new capability and build our experience we gradually become less aware of out new capability – it becomes Second Nature.  We can now do it without thinking – it becomes sort of hard-wired.  Of course, this is a very useful place to get to: it does conceal a danger though – we start to take our capability for granted as we focus our attention on new challenges. We become complacent – and as the world around us is constantly changing we may be unaware our once-appropriate capability may be growing less useful.  Being a wizard with a set of log-tables and a slide-rule became an unnecessary skill when digital calculators appeared – that was fairly obvious.  The silent danger is that we slowly slide from Second-Nature to Blissful-Ignorance; usually as we get older, become more senior, acquire more influence, more money and more power.  We now have the dramatic context for a nasty shock when, as a once capable and respected leader, we suddenly and painfully become aware of our irrelevance. Many leaders do not survive the shock and many organisations do not survive it either – especially if a once-powerful leader switches to self-justifying denial and the blame-others behaviour.

To protect ourselves from this unhappy fate just requires that we understand the dynamic of this deceptively simple model; it requires actively fostering a curious mindset; it requires a willingness to continuously challenge ourselves; to openly learn from a wide network of others who have more capability in the area we want to develop; and to be open to sharing with others what we have learned.  Maybe 360 feedback is not such a scary idea?

Can an Old Dog learn New Tricks?

I learned a new trick this week and I am very pleased with myself for two reasons. Firstly because I had the fortune to have been recommended this trick; and secondly because I had the foresight to persevere when the first attempt didn’t work very well.  The trick I learned was using a webinar to provide interactive training. “Oh that’s old hat!” I hear some of you saying. Yes, teleconferencing and webinars have been around for a while – and when I tried it a few years ago I was disappointed and that early experience probably raised my unconscious resistance. The world has moved on – and I hadn’t. High-speed wireless broadband is now widely available and the webinar software is much improved.  It was a breeze to set up (though getting one’s microphone and speakers to work seems a perennial problem!). The training I was offering was for the BaseLine process behaviour chart software – and by being able to share the dynamic image of the application on my computer with all the invitees I was able to talk through what I was doing, how I was doing it and the reasons why I was doing it.  The immediate feedback from the invitees allowed me to pace the demonstration, repeat aspects that were unclear, answer novel queries and to demonstrate features that I had not intended to in my script.  The tried and tested see-do-teach method has been reborn in the Information Age and this old dog is definitely wagging his tail and looking forward to his walk in the park (and maybe a tasty treat, huh?)

Are your Targets a Pain in the #*&!?

If your delivery time targets are giving you a pain in the #*&! then you may be sitting on a Horned Gaussian and do not realise it. What is a Horned Gaussian? How do you detect one? And what causes it?  To establish the diagnosis you need to gather the data from the most recent couple of hundred jobs and from it calculate the interval from receipt to delivery. Next create a tally chart with Delivery Time on the vertical axis and Counts on the horizontal axis; mark your Delivery Time Target as a horizontal line about two thirds of the way up the vertical axis; draw ten equally spaced lines between it and the X axis and five more above the Target. Finally, sort your delivery times into these “bins” and look at the profile of the histogram that results. If there is a clearly separate “hump” and “horn” and the horn is just under the target then you have confirmed the diagnosis of a Horned Gaussian. The cause is the Delivery Time Target, or more specifically its effect on your behaviour.  If the Target is externally imposed  and enforced using either a reward or a punishment then when the delivery time for a request approaches the Target, you will increase the priority of the request and the job leapfrogs to the front of the queue, pushing all the other jobs back. The order of the jobs is changing and in a severe case the large number of changing priorities generates a lot of extra work to check and reschedule the jobs.  This extra work exacerbates the delays and makes the problem worse, the horn gets taller and sharper, and the pain gets worse. Does that sound a familiar story? So what is the treatment? Well, to decide that you need to create a graph of delivery times in time order and look at the pattern (using charting tool such as BaseLine© www.valuesystemdesign.com makes this easier and quicker). What you do depends on what the chart says to you … it is the Voice of the Process.  Improvement Science is learning to understand the voice of the process.