 [Beep Beep] Bob’s laptop signaled the arrival of Leslie to their regular Webex mentoring session. Bob picked up the phone and connected to the conference call.
<Bob> Hi Leslie, how are you today?
<Leslie> Great thanks Bob. I am sorry but that I do not have a red-hot burning issue to talk about today.
<Bob> OK – so your world is completely calm and orderly now. Excellent.
<Leslie> I wish! The reason is that I have been busy preparing for the monthly 1-2-1 with my boss.
<Bob> OK. So do you have a few minutes to talk about that?
<Leslie> What can I tell you about it?
<Bob> Can you just describe the purpose and the process for me?
<Leslie> OK. The purpose is improvement – for both the department and the individual. The process is that all departmental managers have an annual appraisal based on their monthly 1-2-1 chats and the performance scores for their departments are used to reward the top 15% and to ‘performance manage’ the bottom 15%.
<Bob> H’mmm. What is the commonest emotion that is associated with this process?
<Leslie> I would say somewhere between severe anxiety and abject terror. No one looks forward to it. The annual appraisal feels like a lottery where the odds are stacked against you.
<Bob> Can you explain that a bit more for me?
<Leslie> Well, the most fear comes from being in the bottom 15% – the fear of being ‘handed your hat’ so to speak. Fortunately that fear motivates us to try harder and that usually saves us from the chopper because our performance improves. The cost is the extra stress, working late and taking ‘stuff’ home.
<Bob> OK. And the anxiety?
<Leslie> Paradoxically that mostly comes from the top 15%. They are anxious to sustain their performance. Most do not and the Boss’s Golden Manager can crash spectacularly! We have seen it so often. It is almost as if being the Best carries a curse! So most of us try to stay in the middle of the pack where we do not stick out – a sort of safety in the herd strategy. It is illogical I know because there is always a ‘top’ 15% and a ‘bottom’ 15%.
<Bob> You mentioned before that it feels like a lottery. How come?
<Leslie> Yes – it feels like a lottery but I know it has a rational scientific basis. Someone once showed me the ‘statistically significant evidence’ that proves it works.
<Bob> That what works exactly?
<Leslie> That sticks are more effective than carrots!
<Bob> Really! And what does the performance run charts look like – over the long term – say monthly over 2-3 years?
<Leslie> That is a really good question. They are surprisingly stable – well completely stable in fact. The wobble up and down of course but there is no sign of improvement over the long term – no trend. If anything it is the other way.
<Bob> So what is the rationale for maintaining the stick-is-better-than-the-carrot policy?
<Leslie> Ah! The message we are getting is ‘as performance is not improving and sticks have been scientifically proven to be more effective than carrots then we will be using a bigger stick in future‘.
<Bob> Hence the atmosphere of fear and anxiety?
<Leslie> Exactly. But that is the way it must be I suppose.
<Bob> Actually it is not. This is an invalid design based on rubbish intuitive assumptions and statistical smoke-and-mirrors that creates unmeasurable emotional pain and destroys both people and organisations!
<Leslie> Wow! Bob! I have never heard you use language like that. You are usually so calm and reasonable. This must be really important!
<Bob> It is – and for that reason I need to shock you out of your apathy – and I can do that best by you proving it to yourself – scientifically – with a simple experiment. Are you up for that?
<Leslie> You betcha! This sounds like it is going to be interesting. I had better fasten my safety belt! The Nerve Curve awaits.
The Stick-or-Carrot Experiment
<Bob> Here we go. You will need five coins, some squared-paper and a pencil. Coloured ones are even better.
<Leslie> OK. Does it matter what sort of coins?
<Bob> No. Any will do. Imagine you have four managers called A,B,C and D respectively. Each month the performance of their department is measured as the number of organisational targets that they are above average on. Above average is like throwing a ‘head’, below average is like throwing a ‘tail’. There are five targets – hence the coins
<Leslie>OK. That makes sense – and it feels better to use the measured average – we have demonstrated that arbitrary performance targets are dangers – especially when imposed blindly across all departments.
<Bob> Indeed. So can you design a score sheet to track the data for the experiment.
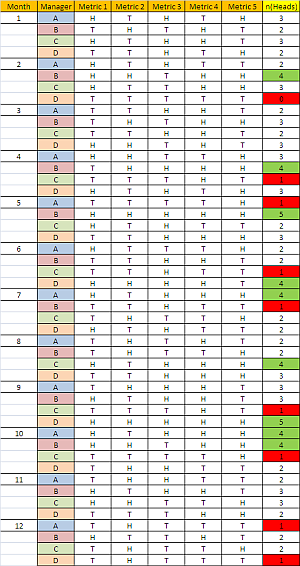
<Leslie>Give me a minute. Will this suffice?
 <Bob> Perfect! Now simulate a month by tossing all five coins – once for each manager – and record the outcome of each as H to T , then tot up the number of heads for each manager.
<Leslie> OK … here is what I got.
 <Bob>Good. Now repeat this 11 more times to give you the results for a whole year. In the n(Heads) column colour the boxes that have scores of zero or one as red – these are the Losers. Then colour the boxes that have 4 or 5 as green – these are the Winners.
<Leslie>OK, that will take me a few minutes – do you want to get a coffee or something.
[Five minutes later]
Here you go. That gives 96 opportunities to win or lose and I counted 9 Losers and 9 Winners so just under 20% for each. The majority were in the unexceptional middle. The herd.
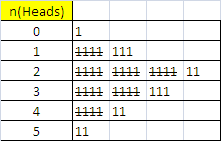
 <Bob> Excellent. A useful way to visualise this is using a Tally chart. Just run down the column of n(Heads) and create the Tally chart as you go. This is one of the oldest forms of counting in existence. There are fossil records that show Tally charts being used thousands of years ago.
<Leslie> I think I understand what you mean. We do not wait until all the data is in then draw the chart, we update it as we go along – as the data comes in.
<Bob> Spot on!
<Leslie> Let me see. Wow! That is so cool! I can see the pattern appearing almost magically – and the more data I have the clearer the pattern is.
<Bob>Can you show me?
<Leslie> Here we go.
 <Bob> Good. This is the expected picture. If you repeated this many times you would get the same general pattern with more 2 and 3 scores.
Now I want you to do an experiment.
Assume each manager that is classed as a Winner in one month is given a reward – a ‘pat on the back’ from their Boss. And each manager that is classed as a Loser is given a ‘written warning’. Now look for the effect that this has.
<Leslie> But we are using coins – which means the outcome is just a matter of chance! It is a lottery.
<Bob> I know that and you know that but let us assume that the Boss believes that the monthly feedback has an effect. The experiment we are doing is to compare the effect of the carrot with the stick. The Boss wants to know which results in more improvement and to know that with scientific and statistical confidence!
<Leslie> OK. So what I will do is look at the score the following month for each manager that was either a Winner or a Loser; work out the difference, and then calculate the average of those differences and compare them with each other. That feels suitably scientific!
<Bob> OK. What do you get.
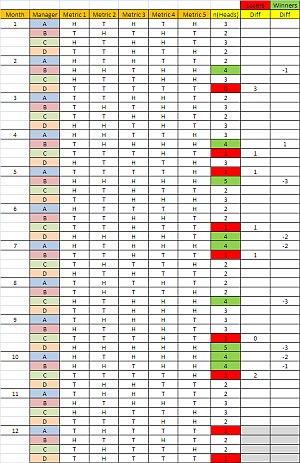
<Leslie> Just a minute, I need to do this carefully. OK – here it is.
<Bob> Excellent. Just eye-balling the ‘Measured improvement after feedback’ columns I would say the Losers have improved and the Winners have deteriorated!
<Leslie> Yes! And the Losers have improved by 1.29 on average and the Winners have deteriorated by 1.78 – and that is a big difference for such small sample. I am sure that with enough data this would be a statistically significant difference! So it is true, sticks work better than carrots!
<Bob>Not so fast. What you are seeing is a completely expected behaviour called “Regression to the Mean“. Remember we know that the score for each manager each month is the result of a game of chance, a coin toss, a lottery. So no amount of stick or carrot feedback is going to influence that.
<Leslie>But the data is saying there is a difference! And that feels like the experience we have – and why fear stalks the management corridors. This is really confusing!
<Bob>Remember that confusion arises from invalid or conflicting unconscious assumptions. There is a flaw in the statistical design of this experiment. The ‘obvious’ conclusion is invalid because of this flaw. And do not be too hard on yourself. The flaw eluded mathematicians for centuries. But now you know there is one can you find it?
<Leslie>OMG! The use of the average to classify the managers into Winners or Losers is the flaw! That is just a lottery. Who the managers are is irrelevant. This is just a demonstration of how chance works.
But that means … OMG! If the conclusion is invalid then sticks are not better than carrots and we have been brain-washed for decades into accepting a performance management system that is invalid – and worse still is used to ‘scientifically’ justify systematic persecution! I can see now why you get so angry!
<Bob>Bravo Leslie. We need to check your understanding. Does that mean carrots are better than sticks?
<Leslie>No! The conclusion is invalid because the assumptions are invalid and the design is fatally flawed. It does not matter what the conclusion actually is.
<Bob>Excellent. So what conclusion can you draw?
<Leslie>That this short-term carrot-or-stick feedback design for achieving improvement in a stable system is both ineffective and emotionally damaging. In fact it could well be achieving precisely the opposite effect that it is intended to. It may be preventing improvement! But the story feels so plausible and the data appears to back it up. What is happening here is we are using statistical smoke-and-mirrors to justify what we have already decided – and only an true expert would spot the flaw! Once again our intuition has tricked us!
<Bob>Well done! And with this new insight – how would you do it differently? What would be a better design?
<Leslie>That is a very good question. I am going to have to think about that – before my 1-2-1 tomorrow. I wonder what might happen if I show this demonstration to my Boss? Thanks Bob, as always … lots of food for thought.
