 The pushmepullyu is a fictional animal immortalised in the 1960’s film Dr Dolittle featuring Rex Harrison who learned from a parrot how to talk to animals. The pushmepullyu was a rare, mysterious animal that was never captured and displayed in zoos. It had a sharp-horned head at both ends and while one head slept the other stayed awake so it was impossible to sneak up on and capture.
The spirit of the pushmepullyu lives on in Improvement Science as Push-Pull and remains equally mysterious and difficult to understand and explain. It is confusing terminology. So what does Push-Pull acually mean?
To decode the terminology we need to first understand a critical metric of any process – the constraint cycle time (CCT) – and to do that we need to define what the terms constraint and cycle time mean.
Consider a process that comprises a series of steps that must be completed in sequence. If we put one task through the process we can measure how long each step takes to complete its contribution to the whole task. This is the touch time of the step and if the resource is immediately available to start the next task this is also the cycle time of the step.
If we now start two tasks at the same time then we will observe when an upstream step has a longer cycle time than the next step downstream because it will shadow the downstream step. In contrast, if the upstream step has a shorter cycle time than the next step down stream then it will expose the downstream step. The differences in the cycle times of the steps will determine the behaviour of the process.
Confused? Probably. The description above is correct BUT hard to understand because we learn better from reality than from rhetoric; and we find pictures work better than words. Pragmatic comes before academic; reality before theory. We need a realistic example to learn from.
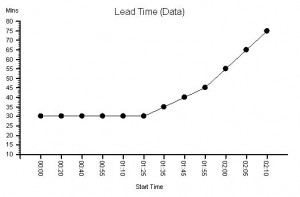 Suppose we have a process that we are told has three steps in sequence, and when one task is put through it takes 30 mins to complete. This is called the lead time and is an important process output metric. We now know it is possible to complete the work in 30 mins so we can set this as our lead time expectation.
Suppose we plot a chart of lead times in the order that the tasks start and record the start time and lead time for each one – and we get a chart that looks like this. It is called a lead time run chart. The first six tasks complete in 30 mins as expected – then it all goes pear-shaped. But why? The run chart does not tell us the reason – it just alerts us to dig deeper.
The clue is in the run chart but we need to know what to look for. We do not know how to do that yet so we need to ask for some more data.
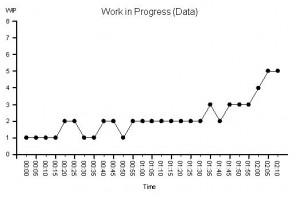 We are given this run chart – which is a count of the number of tasks being worked on recorded at 5 minute intervals. It is the work in progress run chart.
We know that we have a three step process and three separate resources – one for each step. So we know that that if there is a WIP of less than 3 we must have idle resources; and if there is a WIP of more than 3 we must have queues of tasks waiting.
We can see that the WIP run chart looks a bit like the lead time run chart. But it still does not tell us what is causing the unstable behaviour.
In fact we do already have all the data we need to work it out but it is not intuitively obvious how to do it. We feel we need to dig deeper.
We decide to go and see for ourselves and to observe exactly what happens to each of the twelve tasks and each of the three resources. We use these observations to draw a Gantt chart.
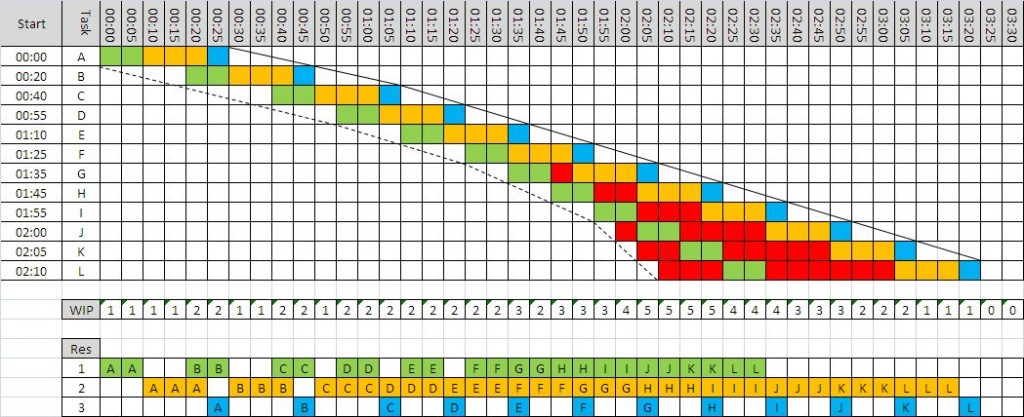 Now we can see what is happening.
We can see that the cycle time of Step 1 (green) is 10 mins; the cycle time for Step 2 (amber) is 15 mins; and the cycle time for Step 3 (blue) is 5 mins.
This explains why the minimum lead time was 30 mins: 10+15+5 = 30 mins. OK – that makes sense now.
Red means tasks waiting and we can see that a lead time longer than 30 mins is associated with waiting – which means one or more queues. We can see that there are two queues – the first between Step 1 and Step 2 which starts to form at Task G and then grows; and the second before Step 1 which first appears for Task J and then grows. So what changes at Task G and Task J?
Looking at the chart we can see that the slope of the left hand edge is changing – it is getting steeper – which means tasks are arriving faster and faster. We look at the interval between the start times and it confirms our suspicion. This data was the clue in the original lead time run chart.
Looking more closely at the differences between the start times we can see that the first three arrive at one every 20 mins; the next three at one every 15 mins; the next three at one every 10 mins and the last three at one every 5 mins.
Ah ha!
Tasks are being pushed into the process at an increasing rate that is independent of the rate at which the process can work.
When we compare the rate of arrival with the cycle time of each step in a process we find that one step will be most exposed – it is called the constraint step and it is the step that controls the flow in the whole process. The constraint cycle time is therefore the critical metric that determines the maximum flow in the whole process – irrespective of how many steps it has or where the constraint step is situated.
If we push tasks into the process slower than the constraint cycle time then all the steps in the process will be able to keep up and no queues will form – but all the resources will be under-utilised. Tasks A to C;
If we push tasks into the process faster than the cycle time of any step then queues will grow upstream of these multiple constraint steps – and those queues will grow bigger, take up space and take up time, and will progressively clog up the resources upstream of the constraints while starving those downstream of work. Tasks G to L.
The optimum is when the work arrives at the same rate as the cycle time of the constraint – this is called pull and it means that the constraint is as the pacemaker and used to pull the work into the process. Tasks D to F.
With this new understanding we can see that the correct rate to load this process is one task every 15 mins – the cycle time of Step 2.
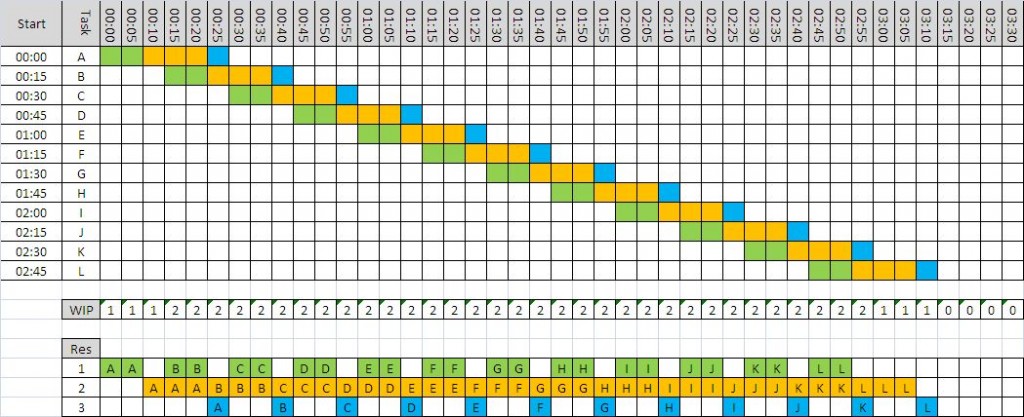 We can use a Gantt chart to predict what would happen.
The waiting is eliminated, the lead time is stable and meeting our expectation, and when task B arrives thw WIP is 2 and stays stable.
In this example we can see that there is now spare capacity at the end for another task – we could increase our productivity; and we can see that we need less space to store the queue which also improves our productivity. Everyone wins. This is called pull scheduling. Pull is a more productive design than push.
To improve process productivity it is necessary to measure the sequence and cycle time of every step in the process. Without that information it is impossible to understand and rationally improve our process.
BUT in reality we have to deal with variation – in everything – so imagine how hard it is to predict how a multi-step process will behave when work is being pumped into it at a variable rate and resources come and go! No wonder so many processes feel unpredictable, chaotic, unstable, out-of-control and impossible to both understand and predict!
This feeling is an illusion because by learning and using the tools and techniques of Improvement Science it is possible to design and predict-within-limits how these complex systems will behave. Improvement Science can unravel this Gordian knot! And it is not intuitively obvious. If it were we would be doing it.

