Pushmepullyu

The pushmepullyu is a fictional animal immortalised in the 1960’s film Dr Dolittle featuring Rex Harrison who learned from a parrot how to talk to animals.  The pushmepullyu was a rare, mysterious animal that was never captured and displayed in zoos. It had a sharp-horned head at both ends and while one head slept the other stayed awake so it was impossible to sneak up on and capture.

The spirit of the pushmepullyu lives on in Improvement Science as Push-Pull and remains equally mysterious and difficult to understand and explain. It is confusing terminology. So what does Push-Pull acually mean?

To decode the terminology we need to first understand a critical metric of any process – the constraint cycle time (CCT) – and to do that we need to define what the terms constraint and cycle time mean.

Consider a process that comprises a series of steps that must be completed in sequence.  If we put one task through the process we can measure how long each step takes to complete its contribution to the whole task.  This is the touch time of the step and if the resource is immediately available to start the next task this is also the cycle time of the step.

If we now start two tasks at the same time then we will observe when an upstream step has a longer cycle time than the next step downstream because it will shadow the downstream step. In contrast, if the upstream step has a shorter cycle time than the next step down stream then it will expose the downstream step. The differences in the cycle times of the steps will determine the behaviour of the process.

Confused? Probably.  The description above is correct BUT hard to understand because we learn better from reality than from rhetoric; and we find pictures work better than words.  Pragmatic comes before academic; reality before theory.  We need a realistic example to learn from.
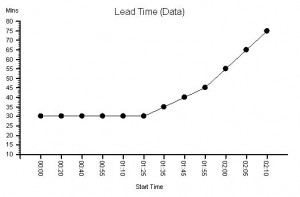
Suppose we have a process that we are told has three steps in sequence, and when one task is put through it takes 30 mins to complete.  This is called the lead time and is an important process output metric. We now know it is possible to complete the work in 30 mins so we can set this as our lead time expectation.  

Suppose we plot a chart of lead times in the order that the tasks start and record the start time and lead time for each one – and we get a chart that looks like this. It is called a lead time run chart.  The first six tasks complete in 30 mins as expected – then it all goes pear-shaped. But why?  The run chart does not tell  us the reason – it just alerts us to dig deeper. 

The clue is in the run chart but we need to know what to look for.  We do not know how to do that yet so we need to ask for some more data.
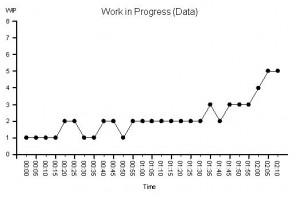
We are given this run chart – which is a count of the number of tasks being worked on recorded at 5 minute intervals. It is the work in progress run chart.

We know that we have a three step process and three separate resources – one for each step. So we know that that if there is a WIP of less than 3 we must have idle resources; and if there is a WIP of more than 3 we must have queues of tasks waiting.

We can see that the WIP run chart looks a bit like the lead time run chart.  But it still does not tell us what is causing the unstable behaviour.

In fact we do already have all the data we need to work it out but it is not intuitively obvious how to do it. We feel we need to dig deeper.

 We decide to go and see for ourselves and to observe exactly what happens to each of the twelve tasks and each of the three resources. We use these observations to draw a Gantt chart.
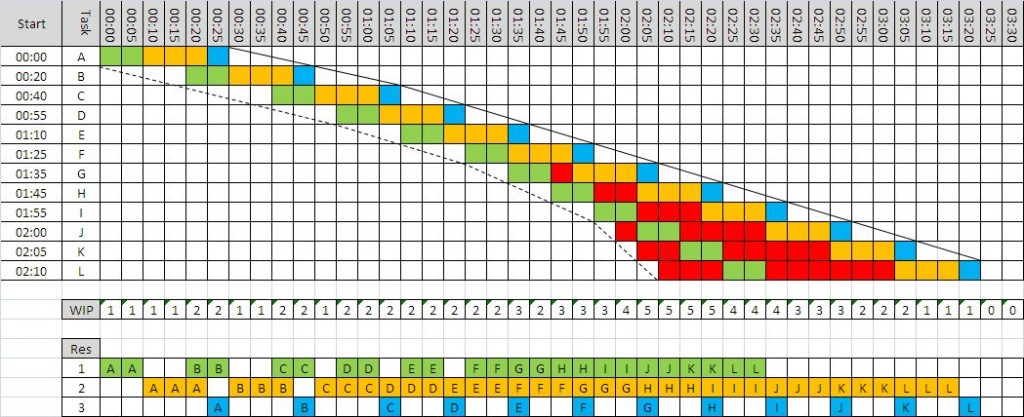
Now we can see what is happening.

We can see that the cycle time of Step 1 (green) is 10 mins; the cycle time for Step 2 (amber) is 15 mins; and the cycle time for Step 3 (blue) is 5 mins.


This explains why the minimum lead time was 30 mins: 10+15+5 = 30 mins. OK – that makes sense now.

Red means tasks waiting and we can see that a lead time longer than 30 mins is associated with waiting – which means one or more queues.  We can see that there are two queues – the first between Step 1 and Step 2 which starts to form at Task G and then grows; and the second before Step 1 which first appears for Task J  and then grows. So what changes at Task G and Task J?

Looking at the chart we can see that the slope of the left hand edge is changing – it is getting steeper – which means tasks are arriving faster and faster. We look at the interval between the start times and it confirms our suspicion. This data was the clue in the original lead time run chart. 

Looking more closely at the differences between the start times we can see that the first three arrive at one every 20 mins; the next three at one every 15 mins; the next three at one every 10 mins and the last three at one every 5 mins.

Ah ha!

Tasks are being pushed  into the process at an increasing rate that is independent of the rate at which the process can work.     

When we compare the rate of arrival with the cycle time of each step in a process we find that one step will be most exposed – it is called the constraint step and it is the step that controls the flow in the whole process. The constraint cycle time is therefore the critical metric that determines the maximum flow in the whole process – irrespective of how many steps it has or where the constraint step is situated.

If we push tasks into the process slower than the constraint cycle time then all the steps in the process will be able to keep up and no queues will form – but all the resources will be under-utilised. Tasks A to C;

If we push tasks into the process faster than the cycle time of any step then queues will grow upstream of these multiple constraint steps – and those queues will grow bigger, take up space and take up time, and will progressively clog up the resources upstream of the constraints while starving those downstream of work. Tasks G to L.

The optimum is when the work arrives at the same rate as the cycle time of the constraint – this is called pull and it means that the constraint is as the pacemaker and used to pull the work into the process. Tasks D to F.

With this new understanding we can see that the correct rate to load this process is one task every 15 mins – the cycle time of Step 2.
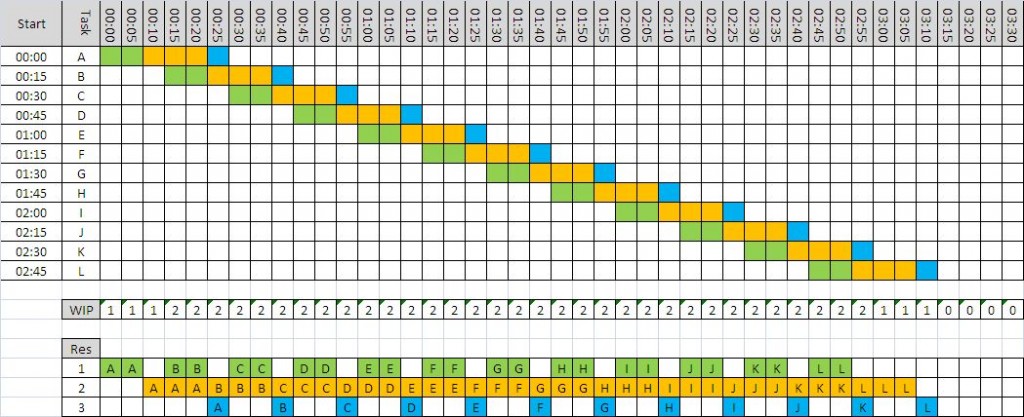
We can use a Gantt chart to predict what would happen.

The waiting is eliminated, the lead time is stable and meeting our expectation, and when task B arrives thw WIP is 2 and stays stable.

In this example we can see that there is now spare capacity at the end for another task – we could increase our productivity; and we can see that we need less space to store the queue which also improves our productivity.  Everyone wins. This is called pull scheduling.  Pull is a more productive design than push. 

To improve process productivity it is necessary to measure the sequence and cycle time of every step in the process.  Without that information it is impossible to understand and rationally improve our process.     

BUT in reality we have to deal with variation – in everything – so imagine how hard it is to predict how a multi-step process will behave when work is being pumped into it at a variable rate and resources come and go! No wonder so many processes feel unpredictable, chaotic, unstable, out-of-control and impossible to both understand and predict!

This feeling is an illusion because by learning and using the tools and techniques of Improvement Science it is possible to design and predict-within-limits how these complex systems will behave.  Improvement Science can unravel this Gordian knot!  And it is not intuitively obvious. If it were we would be doing it.

Low-Tech-Toc

Beware the Magicians who wave High Technology Wands and promise Miraculous Improvements if you buy their Black Magic Boxes!

If a Magician is not willing to open the box and show you the inner workings then run away – quickly.  Their story may be true, the Miracle may indeed be possible, but if they cannot or will not explain HOW the magic trick is done then you will be caught in their spell and will become their slave forever.

Not all Magicians have honourable intentions – those who have been seduced by the Dark Side will ensnare you and will bleed you dry like greedy leeches!

In the early 1980’s a brilliant innovator called Eli Goldratt created a Black Box called OPT that was the tangible manifestation of his intellectual brainchild called ToC – Theory of Constraints. OPT was a piece of complex computer software that was intended to rescue manufacturing from their ignorance and to miraculously deliver dramatic increases in profit. It didn’t.

Eli Goldratt was a physicist and his Black Box was built on strong foundations of Process Physics – it was not Snake Oil – it did work.  The problem was that it did not sell: Not enough people believed his claims and those who did discovered that the Black Box was not as easy to use as the Magician suggested.  So Eli Goldratt wrote a book called The Goal in which he explained, in parable form, the Principles of ToC and the theoretical foundations on which his Black Box was built.  The book was a big success but his Black Box still did not sell; just an explanation of how his Black Box worked was enough for people to apply the Principles of ToC and to get dramatic results. So, Eli abandoned his plan of making a fortune selling Black Boxes and set up the Goldratt Institute to disseminate the Principles of ToC – which he did with considerably more success. Eli Goldratt died in June 2011 after a short battle with cancer and the World has lost a great innovator and a founding father of Improvement Science. His legacy lives on in the books he wrote that chart his personal journey of discovery.

The Principles of ToC are central both to process improvement and to process design.  As Eli unintentionally demonstrated, it is more effective and much quicker to learn the Principles of ToC pragmatically and with low technology – such as a book – than with a complex, expensive, high technology Black Box.  As many people have discovered – adding complex technology to a complex problem does not create a simple solution! Many processes are relatively uncomplicated and do not require high technology solutions. An example is the challenge of designing a high productivity schedule when there is variation in both the content and the volume of the work.

If our required goal is to improve productivity (or profit) then we want to improve the throughput and/or to reduce the resources required. That is relatively easy when there is no variation in content and no variation in volume – such as when we are making just one product at a constant rate – like a Model-T Ford in Black! Add some content and volume variation and the challenge becomes a lot trickier! From the 1950’s the move from mass production to mass customisation in the automobile industry created this new challenge and spawned a series of  innovative approaches such as the Toyota Production System (Lean), Six Sigma and Theory of Constraints.  TPS focussed on small batches, fast changeovers and low technology (kanbans or cards) to keep inventory low and flow high; Six Sigma focussed on scientifically identifying and eliminating all sources of variation so that work flows smoothly and in “statistical control”; ToC focussed on identifying the “constraint steps” in the system and then on scheduling tasks so that the constraints never run out of work.

When applied to a complex system of interlinked and interdependent processes the ToC method requires a complicated Black Box to do the scheduling because we cannot do it in our heads. However, when applied to a simpler system or to a part of a complex system it can be done using a low technology method called “paper and pen”. The technique is called Template Scheduling and there is a real example in the “Three Wins” book where the template schedule design was tested using a computer simulation to measure the resilience of the design to natural variation – and the computer was not used to do the actual scheduling. There was no Black Box doiung the scheduling. The outcome of the design was a piece of paper that defined the designed-and-tested template schedule: and the design testing predicted a 40% increase in throughput using the same resources. This dramatic jump in productivity might be regarded as  “miraculous” or even “impossible” but only to someone who was not aware of the template scheduling method. The reality is that that the designed schedule worked just as predicted – there was no miracle, no magic, no Magician and no Black Box.

The Crime of Metric Abuse

We live in a world that is increasingly intolerant of errors – we want everything to be right all the time – and if it is not then someone must have erred with deliberate intent so they need to be named, blamed and shamed! We set safety standards and tough targets; we measure and check; and we expose and correct anyone who is non-conformant. We accept that is the price we must pay for a Perfect World … Yes? Unfortunately the answer is No. We are deluded. We are all habitual criminals. We are all guilty of committing a crime against humanity – the Crime of Metric Abuse. And we are blissfully ignorant of it so it comes as a big shock when we learn the reality of our unconscious complicity.

You might want to sit down for the next bit.

First we need to set the scene:
1. Sustained improvement requires actions that result in irreversible and beneficial changes to the structure and function of the system.
2. These actions require making wise decisions – effective decisions.
3. These actions require using resources well – efficient processes.
4. Making wise decisions requires that we use our system metrics correctly.
5. Understanding what correct use is means recognising incorrect use – abuse awareness.

When we commit the Crime of Metric Abuse, even unconsciously, we make poor decisions. If we act on those decisions we get an outcome that we do not intend and do not want – we make an error.  Unfortunately, more efficiency does not compensate for less effectiveness – if fact it makes it worse. Efficiency amplifies Effectiveness – “Doing the wrong thing right makes it wronger not righter” as Russell Ackoff succinctly puts it.  Paradoxically our inefficient and bureaucratic systems may be our only defence against our ineffective and potentially dangerous decision making – so before we strip out the bureaucracy and strive for efficiency we had better be sure we are making effective decisions and that means exposing and treating our nasty habit for Metric Abuse.

Metric Abuse manifests in many forms – and there are two that when combined create a particularly virulent addiction – Abuse of Ratios and Abuse of Targets. First let us talk about the Abuse of Ratios.

A ratio is one number divided by another – which sounds innocent enough – and ratios are very useful so what is the danger? The danger is that by combining two numbers to create one we throw away some information. This is not a good idea when making the best possible decision means squeezing every last drop of understanding our of our information. To unconsciously throw away useful information amounts to incompetence; to consciously throw away useful information is negligence because we could and should know better.

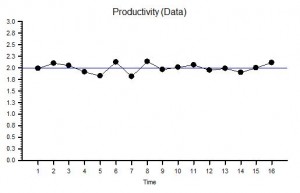
Here is a time-series chart of a process metric presented as a ratio. This is productivity – the ratio of an output to an input – and it shows that our productivity is stable over time.  We started OK and we finished OK and we congratulate ourselves for our good management – yes? Well, maybe and maybe not.  Suppose we are measuring the Quality of the output and the Cost of the input; then calculating our Value-For-Money productivity from the ratio; and then only share this derived metric. What if quality and cost are changing over time in the same direction and by the same rate? The productivity ratio will not change.


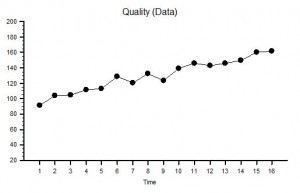
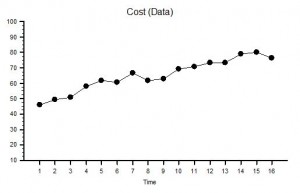
Suppose the raw data we used to calculate our ratio was as shown in the two charts of measured Ouput Quality and measured Input Cost  – we can see immediately that, although our ratio is telling us everything is stable, our system is actually changing over time – it is unstable and therefore it is unpredictable. Systems that are unstable have a nasty habit of finding barriers to further change and when they do they have a habit of crashing, suddenly, unpredictably and spectacularly. If you take your eyes of the white line when driving and drift off course you may suddenly discover a barrier – the crash barrier for example, or worse still an on-coming vehicle! The apparent stability indicated by a ratio is an illusion or rather a delusion. We delude ourselves that we are OK – in reality we may be on a collision course with catastrophe. 

But increasing quality is what we want surely? Yes – it is what we want – but at what cost? If we use the strategy of quality-by-inspection and add extra checking to detect errors and extra capacity to fix the errors we find then we will incur higher costs. This is the story that these Quality and Cost charts are showing.  To stay in business the extra cost must be passed on to our customers in the price we charge: and we have all been brainwashed from birth to expect to pay more for better quality. But what happens when the rising price hits our customers finanical constraint?  We are no longer able to afford the better quality so we settle for the lower quality but affordable alternative.  What happens then to the company that has invested in quality by inspection? It loses customers which means it loses revenue which is bad for its financial health – and to survive it starts cutting prices, cutting corners, cutting costs, cutting staff and eventually – cutting its own throat! The delusional productivity ratio has hidden the real problem until a sudden and unpredictable drop in revenue and profit provides a reality check – by which time it is too late. Of course if all our competitors are committing the same crime of metric abuse and suffering from the same delusion we may survive a bit longer in the toxic mediocrity swamp – but if a new competitor who is not deluded by ratios and who learns how to provide consistently higher quality at a consistently lower price – then we are in big trouble: our customers leave and our end is swift and without mercy. Competition cannot bring controlled improvement while the Abuse of Ratios remains rife and unchallenged.

Now let us talk about the second Metric Abuse, the Abuse of Targets.

The blue line on the Productivity chart is the Target Productivity. As leaders and managers we have bee brainwashed with the mantra that “you get what you measure” and with this belief we commit the crime of Target Abuse when we set an arbitrary target and use it to decide when to reward and when to punish. We compound our second crime when we connect our arbitrary target to our accounting clock and post periodic praise when we are above target and periodic pain when we are below. We magnify the crime if we have a quality-by-inspection strategy because we create an internal quality-cost tradeoff that generates conflict between our governance goal and our finance goal: the result is a festering and acrimonious stalemate. Our quality-by-inspection strategy paradoxically prevents improvement in productivity and we learn to accept the inevitable oscillation between good and bad and eventually may even convince ourselves that this is the best and the only way.  With this life-limiting-belief deeply embedded in our collective unconsciousness, the more enthusiastically this quality-by-inspection design is enforced the more fear, frustration and failures it generates – until trust is eroded to the point that when the system hits a problem – morale collapses, errors increase, checks are overwhelmed, rework capacity is swamped, quality slumps and costs escalate. Productivity nose-dives and both customers and staff jump into the lifeboats to avoid going down with the ship!  

The use of delusional ratios and arbitrary targets (DRATs) is a dangerous and addictive behaviour and should be made a criminal offense punishable by Law because it is both destructive and unnecessary.

With painful awareness of the problem a path to a solution starts to form:

1. Share the numerator, the denominator and the ratio data as time series charts.
2. Only put requirement specifications on the numerator and denominator charts.
3. Outlaw quality-by-inspection and replace with quality-by-design-and-improvement.  

Metric Abuse is a Crime. DRATs are a dangerous addiction. DRATs kill Motivation. DRATs Kill Organisations.

Charts created using BaseLine

JIT, WIP, LIP and PIP

It is a fantastic feeling when a piece of the jigsaw falls into place and suddenly an important part of the bigger picture emerges. Feelings of confusion, anxiety and threat dissipate and are replaced by a sense of insight, calm and opportunitity.

Improvement Science is about 80% subjective and 20% objective: more cultural than technical – but the technical parts are necessary. Processes obey the Laws of Physics – and unlike the Laws of People these not open to appeal or repeal. So when an essential piece of process physics is missing the picture is incomplete and confusion reigns.

One piece of the process physics jigsaw is JIT (Just-In-Time) and process improvement zealots rant on about JIT as if it were some sort of Holy Grail of Improvement Science.  JIT means what you need arrives just when you need it – which implies that there is no waiting of it-for-you or you-for-it.  JIT is an important output of an improved process; it is not an input!  The danger of confusing output with input is that we may then try to use delivery time as a mangement metric rather than a performance metric – and if we do that we get ourselves into a lot of trouble. Delivery time targets are often set and enforced and to a large extent fail to achieve their intention because of this confusion.  To understand how to achieve JIT requires more pieces of the process physics jigsaw. The piece that goes next to JIT is labelled WIP (Work In Progress) which is the number of jobs that are somewhere between starting and finishing.  JIT is achieved when WIP is low enough to provide the process with just the right amount of resilience to absorb inevitable variation; and WIP is a more useful management metric than JIT for many reasons (which for brevity I will not explain here). Monitoring WIP enables a process manager to become more proactive because changes in WIP can signal a future problem with JIT – giving enough warning to do something.  However, although JIT and WIP are necessary they are not sufficient – we need a third piece of the jigsaw to allow us to design our process to deliver the JIT performance we want.  This third piece is called LIP (Load-In-Progress) and is the parameter needed to plan and schedule  the right capacity at the right place and the right time to achieve the required WIP and JIT.  Together these three pieces provide the stepping stones on the path to Productivity Improvement Planning (PIP) that is the combination of QI (Quality Improvement) and CI (Cost Improvement).

So if we want our PIP then we need to know our LIP and WIP to get the JIT.  Reddit? Geddit?         

Does More Efficient equal More Productive?

It is often assumed that efficiency and productivity are the same thing – and this assumption leads to the conclusion that if we use our resources more efficiently then we will automatically be more productive. This is incorrect. The definition of productivity is the ratio of what we expect to get out divided by what we put in – and the important caveat to remember is that only the output which meets expectation is counted – only output that passes the required quality specification.

This caveat has two important implications:

1. Not all activity contributes to productivity. Failures do not.
2. To measure productivity we must define a quality specification.

Efficiency is how resources are used and is often presented as metric called utilisation – the ratio of how much time a resource was used to how much time a resource was available.  So, utilisation includes time spent by resources detecting and correcting avoidable errors.

Increasing utilisation does not always imply increasing productivity: It is possible to become more efficient and less productive by making, checking, detecting and fixing more errors.

For example, if we make more mistakes we will have more output that fails to meet the expected quality, our customers complain and productivity has gone down. Our standard reaction to this situation is to put pressure on ourselves to do more checking and to correct the erros we find – which implies that our utilisation has gone up but our productivity has remained down: we are doing more work to achieve the same outcome.

However, if we remove the cause of the mistakes then more output will meet the quality specification and productivity will go up (better outcome with same resources); and we also have have less re-work to do so utilisation goes down which means productivity goes up even further (remember: productivity = success out divided by effort in). Fixing the root case of errors delivers a double-productivity-improvement.

In the UK we have become a victim of our own success – we have a population that is living longer (hurray) and that will present a greater demand for medical care in the future – however the resources that are available to provide healthcare cannot increase at the same pace (boo) – so we have a problem looming that is not going to go away just by ignoring it. Our healthcare system needs to become more productive. It needs to deliver more care with the same cash – and that implies three requirements:
1. We need to specify our expectation of required quality.
2. We need to measure productivity so that we can measure improvement over time.
3. We need to diagnose the root-causes of errors rather than just treat their effects.

Improved productivity requires improved quality and lower costs – which is good because we want both!