
 We live in a world that is increasingly intolerant of errors – we want everything to be right all the time – and if it is not then someone must have erred with deliberate intent so they need to be named, blamed and shamed! We set safety standards and tough targets; we measure and check; and we expose and correct anyone who is non-conformant. We accept that is the price we must pay for a Perfect World … Yes? Unfortunately the answer is No. We are deluded. We are all habitual criminals. We are all guilty of committing a crime against humanity – the Crime of Metric Abuse. And we are blissfully ignorant of it so it comes as a big shock when we learn the reality of our unconscious complicity.
You might want to sit down for the next bit.
First we need to set the scene:
1. Sustained improvement requires actions that result in irreversible and beneficial changes to the structure and function of the system.
2. These actions require making wise decisions – effective decisions.
3. These actions require using resources well – efficient processes.
4. Making wise decisions requires that we use our system metrics correctly.
5. Understanding what correct use is means recognising incorrect use – abuse awareness.
When we commit the Crime of Metric Abuse, even unconsciously, we make poor decisions. If we act on those decisions we get an outcome that we do not intend and do not want – we make an error. Unfortunately, more efficiency does not compensate for less effectiveness – if fact it makes it worse. Efficiency amplifies Effectiveness – “Doing the wrong thing right makes it wronger not righter” as Russell Ackoff succinctly puts it. Paradoxically our inefficient and bureaucratic systems may be our only defence against our ineffective and potentially dangerous decision making – so before we strip out the bureaucracy and strive for efficiency we had better be sure we are making effective decisions and that means exposing and treating our nasty habit for Metric Abuse.
Metric Abuse manifests in many forms – and there are two that when combined create a particularly virulent addiction – Abuse of Ratios and Abuse of Targets. First let us talk about the Abuse of Ratios.
A ratio is one number divided by another – which sounds innocent enough – and ratios are very useful so what is the danger? The danger is that by combining two numbers to create one we throw away some information. This is not a good idea when making the best possible decision means squeezing every last drop of understanding our of our information. To unconsciously throw away useful information amounts to incompetence; to consciously throw away useful information is negligence because we could and should know better.
 Here is a time-series chart of a process metric presented as a ratio. This is productivity – the ratio of an output to an input – and it shows that our productivity is stable over time. We started OK and we finished OK and we congratulate ourselves for our good management – yes? Well, maybe and maybe not. Suppose we are measuring the Quality of the output and the Cost of the input; then calculating our Value-For-Money productivity from the ratio; and then only share this derived metric. What if quality and cost are changing over time in the same direction and by the same rate? The productivity ratio will not change.
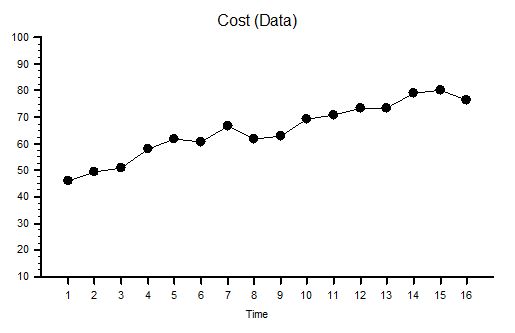
 Suppose the raw data we used to calculate our ratio was as shown in the two charts of measured Ouput Quality and measured Input Cost – we can see immediately that, although our ratio is telling us everything is stable, our system is actually changing over time – it is unstable and therefore it is unpredictable. Systems that are unstable have a nasty habit of finding barriers to further change and when they do they have a habit of crashing, suddenly, unpredictably and spectacularly. If you take your eyes of the white line when driving and drift off course you may suddenly discover a barrier – the crash barrier for example, or worse still an on-coming vehicle! The apparent stability indicated by a ratio is an illusion or rather a delusion. We delude ourselves that we are OK – in reality we may be on a collision course with catastrophe.
 But increasing quality is what we want surely? Yes – it is what we want – but at what cost? If we use the strategy of quality-by-inspection and add extra checking to detect errors and extra capacity to fix the errors we find then we will incur higher costs. This is the story that these Quality and Cost charts are showing. To stay in business the extra cost must be passed on to our customers in the price we charge: and we have all been brainwashed from birth to expect to pay more for better quality. But what happens when the rising price hits our customers finanical constraint? We are no longer able to afford the better quality so we settle for the lower quality but affordable alternative. What happens then to the company that has invested in quality by inspection? It loses customers which means it loses revenue which is bad for its financial health – and to survive it starts cutting prices, cutting corners, cutting costs, cutting staff and eventually – cutting its own throat! The delusional productivity ratio has hidden the real problem until a sudden and unpredictable drop in revenue and profit provides a reality check – by which time it is too late. Of course if all our competitors are committing the same crime of metric abuse and suffering from the same delusion we may survive a bit longer in the toxic mediocrity swamp – but if a new competitor who is not deluded by ratios and who learns how to provide consistently higher quality at a consistently lower price – then we are in big trouble: our customers leave and our end is swift and without mercy. Competition cannot bring controlled improvement while the Abuse of Ratios remains rife and unchallenged.
Now let us talk about the second Metric Abuse, the Abuse of Targets.
The blue line on the Productivity chart is the Target Productivity. As leaders and managers we have bee brainwashed with the mantra that “you get what you measure” and with this belief we commit the crime of Target Abuse when we set an arbitrary target and use it to decide when to reward and when to punish. We compound our second crime when we connect our arbitrary target to our accounting clock and post periodic praise when we are above target and periodic pain when we are below. We magnify the crime if we have a quality-by-inspection strategy because we create an internal quality-cost tradeoff that generates conflict between our governance goal and our finance goal: the result is a festering and acrimonious stalemate. Our quality-by-inspection strategy paradoxically prevents improvement in productivity and we learn to accept the inevitable oscillation between good and bad and eventually may even convince ourselves that this is the best and the only way. With this life-limiting-belief deeply embedded in our collective unconsciousness, the more enthusiastically this quality-by-inspection design is enforced the more fear, frustration and failures it generates – until trust is eroded to the point that when the system hits a problem – morale collapses, errors increase, checks are overwhelmed, rework capacity is swamped, quality slumps and costs escalate. Productivity nose-dives and both customers and staff jump into the lifeboats to avoid going down with the ship!
The use of delusional ratios and arbitrary targets (DRATs) is a dangerous and addictive behaviour and should be made a criminal offense punishable by Law because it is both destructive and unnecessary.
With painful awareness of the problem a path to a solution starts to form:
1. Share the numerator, the denominator and the ratio data as time series charts.
2. Only put requirement specifications on the numerator and denominator charts.
3. Outlaw quality-by-inspection and replace with quality-by-design-and-improvement.
Metric Abuse is a Crime. DRATs are a dangerous addiction. DRATs kill Motivation. DRATs Kill Organisations.
Charts created using BaseLine
