W. Edwards Deming (1900-1993) is sometimes referred to as the Father of Quality. He made such a significant contribution to Japan’s burgeoning post-war reputation for innovative high-quality products, and the rapid development of their economic power, that he is regarded as having made more of a difference than any other individual not of Japanese heritage.
Though best known as a statistician and economist, he was initially educated as an electrical engineer and mathematical physicist. To me however he was more of a social scientist – interested in the science of improvement and the creation of value for customers. A lifelong learner, in his later years (1) he became fascinated by epistemology – the processes by which knowledge is created – and this led him into wanting to know more about the psychology of human behaviour and its underlying motivations.
In his nineties he put his whole life of learning into one model – his System of Profound Knowledge (SoPK). What follows is my brief take on each of the four elements of the SoPK and how they fit together.
THE PSYCHOLOGY OF HUMAN BEHAVIOUR
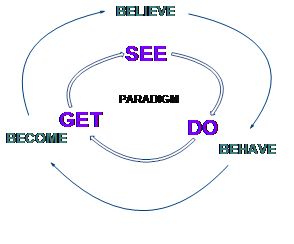 Everyone is different, and we all SEE things differently. We then DO things based on how we see things – and we GET results – of some kind. Over time we shore up our own particular view of the world – some call this a “paradigm” – our own particular world view – multiple loops of DO-GET-SEE (2) are self-reinforcing and as our sense making becomes increasingly fixed we BEHAVE – BECOME – BELIEVE. The trouble is we each to some extent get divorced from reality, or at least how most others see it – in extreme cases we might even get classified by some people as “insane” – indeed the clinical definition of insanity is doing the same things whilst expecting different results.
THE ACQUISITION OF KNOWLEDGE
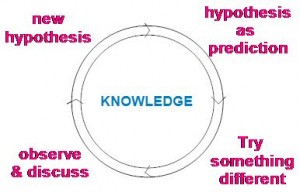 So when we DO things it would be helpful if we could do them as little experiments that test our sense of what works and what is real. Even better we might get others to help us interpret the results from the benefit of their particular world view/ paradigm. Did you study science at school? If so you might recognize that learning in this way by experimentation is the “scientific method” in action. Through these cycles of learning knowledge gets continually refined and builds. It is also where improvement comes from and how reality evolves. Deming referred to this as the PLAN-DO-STUDY-ACT Cycle (1) – personally i prefer the words in this adjacent diagram. For me the cycle is as much about good mental health as acquiring knowledge, because effective learning (3) keeps individuals and organizations connected to reality and in control of their lives.
UNDERSTANDING VARIATION
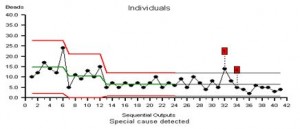 The origins of PDSA lie with Walter Shewhart (4) who in 1925 – invented it to help people in organizations methodically and continually inquire into what is happening. He observed that when workers or managers make changes in their working practices so that their processes run better, the results vary, and that this variation often fools them. So he invented a tool for collecting numbers in real time so that each process can be listened in to as a “system” – much like a doctor uses a stethoscope to collect data and interpret how their patient’s system is behaving, by asking what might be contributing to – actually causing – the system’s outcomes. Shewhart named the tool Statistical Process Control – three words, each of which for many people are an instant turn-off. This means they miss his critical insight that there are two distinct types of variation – noise and signal, and that whilst all systems contain noise, only some contain signals – which if present can be taken to be assignable causes of systemic behaviour. Indeed to make it more palatable the tool might better be referred to as a “system behaviour chart”. It is meant to be interpreted like a doctor or nurse interprets the vital sign graph on the end of a patient’s bed i.e. to decide what action if any to take and when. Here is an example that has been created in BaseLine© which is specifically designed to offer the agnostic direct access to the power of Shewhart’s thinking. (5).
THINKING SYSTEMICALLY
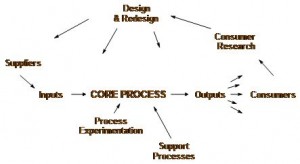 What is meant by the word “system”? It means all the parts connected and interrelated as a whole (3). It is often helpful to get representatives of the various stakeholder groups to map the system – with its parts, the flows and the connections – so they can see how different people make sense of say.. their family system, their work system, a particular process of interest.. indeed any system of any kind that feels important to them. The map shown here is one used that might be used generically by manufacturers to help them investigate the separate causal sources of systemic variation – from the Suppliers of Inputs received, to the Processes that convert those inputs into Outputs, which can then be received by Customers – all made possible by vital support processes. This map (1) was taught by Deming in 1950 to Japan’s leaders. When making sense of their own particular systemic context others may prefer a different kind of map, but why? How come others prefer to make sense of things in their own way? To answer this Peter Senge (3) in his own equivalent to the SoPK says you need 5 distinct disciplines: the ability to think systemically, to learn as a team, to create a shared vision, to understand how our mental models get ingrained, and lastly “personal mastery” … which takes me back to where I started.
Aware that he was at the end of his life of learning, Deming bequeathed his System of Profound Knowledge to us so that we might continue his work. Personally, I love the SoPK because it is so complete. It is hard however to keep such a model, complete and as a whole, continually in the front of our minds – such that everything we think and do can be viewed as a fractal of that elegant whole. Indeed as a system, the system of profound knowledge is seriously – even fatally – undermined if any single part is missing ..
• Without understanding the causes of human behaviour we have no empathy for other people’s worldviews, other value systems. Without empathy our ability to manage change is fundamentally impaired.
• Without being good at experimentation and turning our experience into Knowledge – the very essence of science – we threaten our very mental health.
• Without understanding variation we are all too easily deluded – ask any magician (6). We spin our own reality. In ignoring or falsely interpreting data we are even “wilfully blind” (7). Baseline© for example is designed to help people make more of their time-series data – a window onto the system that their data is representing – using its inherent variation to gain an enhanced sense of what’s actually happened, as well as what’s really happening, and what if things stay the same is most likely to happen.
• Without being able to see how things are connected – as a whole system – and seeing the uniqueness of our own particular context, moment to moment, we miss the importance of our maps – and those of others – for good sense-making. We therefore miss the sharing of our individual realities, and with it the potential to spot what really causes outcomes – which neatly takes us back to the need for empathy and for understanding the psychology of human behaviour.
For me the challenge is to be continually striving for that sense of the SoPK – as a complete whole – and by doing this to see how I might grow my influence in the world.
Julian Simcox
References
1. Deming W.E – The New Economics – 1993
2. Covey S.R. – The 7 habits of Highly Effective People – 1989
3. Senge P. M. – The Fifth Discipline: the art and practice of the learning organization – 1990
4. Wheeler D.J. & Poling S.R.– Building Continual Improvement – 1998
5. BaseLine© is available via www.threewinsacademy.co.uk.
6. Macknik S, et al – Sleights of Mind – What the neuroscience of magic reveals about our brains – 2011.
7. Heffernan M. – Wilfully Blind – 2011
 If you put an ear to someones chest you can hear their heart “lub-dub lub-dub lub-dub”. The sound is caused by the valves in the heart closing, like softly slamming doors, as part of the wonderfully orchestrated process of pumping blood around the lungs and body. The heart is an impressive example of bioengineering but it was not designed – it evolved over time – its elegance and efficiency emerged over a long journey of emergent evolution. The lub-dub is a comforting sound – it signals regularity, predictability, and stabilty; and was probably the first and most familiar sound each of heard in the womb. Our hearts are sensitive to our emotional state – and it is no accident that the beat of music mirrors the beat of the heart: slow means relaxed and fast means aroused.
