Doing Our Way to New Thinking.

Most of our thinking happens out of awareness – it is unconscious. Most of the data that pours in through our senses never reaches awareness either – but that does not mean it does not have an impact on what we remember, how we feel and what we decide and do in the future. It does.

Improvement Science is the knowledge of how to achieve sustained change for the better; and doing that requires an ability to unlearn unconscious knowledge that blocks our path to improvement – and to unlearn selectively.

So how can we do that if it is unconscious? Well, there are  at least two ways:

1. Bring the unconscious knowledge to the surface so it can be examined, sorted, kept or discarded. This is done through the social process of debate and discussion. It does work though it can be a slow and difficult process.

2. Do the unlearning at the unconscious level – and we can do that by using reality rather than rhetoric. The easiest way to connect ourselves to reality is to go out there and try doing things.

When we deliberately do things  we are learning unconsciously because most of our sensory data never reaches awareness.  When we are just thinking the unconscious is relatively unaffected: talking and thinking are the same conscious process. Discussion and dialog operate at the conscious level but differ in style – discussion is more competitive; dialog is more collaborative. 

The door to the unconscious is controlled by emotions – and it appears that learning happens more effectively and more efficiently in certain emotional states. Some emotional states can impair learning; such as depression, frustration and anxiety. Strong emotional states associated with dramatic experiences can result in profound but unselective learning – the emotionally vivid memories that are often associated with unpleasant events.  Sometimes the conscious memory is so emotionally charged and unpleasant that it is suppressed – but the unconscious memory is not so easily erased – so it continues to influence but out of awareness. The same is true for pleasant emotional experiences – they can create profound learning experiences – and the conscious memory may be called an inspirational or “eureka” moment – a sudden emotional shift for the better. And it too is unselective and difficult to erase.

An emotionally safe environment for doing new things and having fun at the same time comes close to the ideal context for learning. In such an enviroment we learn without effort. It does not feel like work – yet we know we have done work because we feel tired afterwards.  And if we were to record the way that we behave and talk before the doing; and again afterwards then we will measure a change even though we may not notice the change ourselves. Other people may notice before we do – particularly if the change is significant – or if they only interact with us occasionally.

It is for this reason that keeping a personal journal is an effective way to capture the change in ourselves over time.  

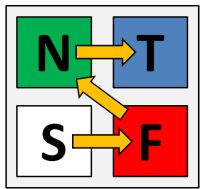
The Jungian model of personality types states that there are three dimensions to personality (Isabel Briggs Myers added a fourth later to create the MBTI®).

One dimension describes where we prefer to go for input data – sensors (S) use external reality as their reference – intuitors (N) use their internal rhetoric.

Another dimension is how we make decisions –  thinkers (T) prefer a conscious, logical, rational, sequential decision process while feelers (F) favour an unconscious, emotional, “irrational”, parallel approach.

The third dimension is where we direct the output of our decisions – extraverts (E) direct it outwards into the public outside world while intraverts (I) direct it inwards to their private inner world.

Irrespective of our individual preferences, experience suggests that an effective learning sequence starts with our experience of reality (S) and depending how emotionally loaded it is (F) we may then internalise the message as a general intuitive concept (N) or a specific logical construct (T).

The implication of this is that to learn effectively and efficiently we need to be able to access all four modes of thinking and to do that we might design our teaching methods to resonate with this natural learning sequence, focussing on creating surprisingly positive reality based emotional experiences first. And we must be mindful that if we skip steps or create too many emotionally negative experiences we we may unintentionally impair the effectiveness of the learning process.

A carefully designed practical exercise that takes just a few minutes to complete can be a much more effective and efficient way to teach a profound principle than to read libraries of books or to listen to hours of rhetoric.  Indeed some of the most dramatic shifts in our understanding of the Universe have been facilitated by easily repeatable experiments.

Intuition and emotions can trick us – so Doing Our Way to New Thinking may be a better improvement strategy.

Lub-Hub Lub-Hub Lub-Hub

If you put an ear to someones chest you can hear their heart “lub-dub lub-dub lub-dub”. The sound is caused by the valves in the heart closing, like softly slamming doors, as part of the wonderfully orchestrated process of pumping blood around the lungs and body. The heart is an impressive example of bioengineering but it was not designed – it evolved over time – its elegance and efficiency emerged over a long journey of emergent evolution.  The lub-dub is a comforting sound – it signals regularity, predictability, and stabilty; and was probably the first and most familiar sound each of heard in the womb. Our hearts are sensitive to our emotional state – and it is no accident that the beat of music mirrors the beat of the heart: slow means relaxed and fast means aroused.

Systems and processes have a heart beat too – but it is not usually audible. It can been seen though if the measures of a process are plotted as time series charts. Only artificial systems show constant and unwavering behaviour – rigidity –  natural systems have cycles.  The charts from natural systems show the “vital signs” of the system.  One chart tells us something of value – several charts considered together tell us much more.

We can measure and display the electrical activity of the heart over time – it is called an electrocardiogram (ECG) -literally “electric-heart-picture”; we can measure and display the movement of muscles, valves and blood by beaming ultrasound at the heart – an echocardiogram; we can visualise the pressure of the blood over time – a plethysmocardiogram; and we can visualise the sound the heart makes – a phonocardiogram. When we display the various cardiograms on the same time scale one above the other we get a much better understanding of how the heart is behaving  as a system. And if we have learned what to expect to see with in a normal heart we can look for deviations from healthy behaviour and use those to help us diagnose the cause.  With experience the task of diagnosis becomes a simple, effective and efficient pattern matching exercise.

The same is true of systems and processes – plotting the system metrics as time-series charts and searching for the tell-tale patterns of process disease can be a simple, quick and accurate technique: when you have learned what a “healthy” process looks like and which patterns are caused by which process “diseases”.  This skill is gained through Operations Management training and lots of practice with the guidance of an experienced practitioner. Without this investment in developing knowlewdge and understanding there is a high risk of making a wrong diagnosis and instituting an ineffective or even dangerous treatment.  Confidence is good – competence is even better.

The objective of process diagnostics is to identify where and when the LUBs and HUBs appear are in the system: a LUB is a “low utilisation bottleneck” and a HUB is a “high utilisation bottleneck”.  Both restrict flow but they do it in different ways and therefore require different management. If we confuse a LUB for a HUB and choose the wrong treatent we can unintentionally make the process sicker – or even kill the system completely. The intention is OK but if we are not competent the implementation will not be OK.

Improvement Science rests on two foundations stones – Operations Management and Human Factors – and managers of any process or system need an understanding of both and to be able to apply their knowledge in practice with competence and confidence.  Just as a doctor needs to understand how the heart works and how to apply this knowledge in clinical practice. Both technical and emotional capability is needed – the Head and the Heart need each other.                          

The Crime of Metric Abuse

We live in a world that is increasingly intolerant of errors – we want everything to be right all the time – and if it is not then someone must have erred with deliberate intent so they need to be named, blamed and shamed! We set safety standards and tough targets; we measure and check; and we expose and correct anyone who is non-conformant. We accept that is the price we must pay for a Perfect World … Yes? Unfortunately the answer is No. We are deluded. We are all habitual criminals. We are all guilty of committing a crime against humanity – the Crime of Metric Abuse. And we are blissfully ignorant of it so it comes as a big shock when we learn the reality of our unconscious complicity.

You might want to sit down for the next bit.

First we need to set the scene:
1. Sustained improvement requires actions that result in irreversible and beneficial changes to the structure and function of the system.
2. These actions require making wise decisions – effective decisions.
3. These actions require using resources well – efficient processes.
4. Making wise decisions requires that we use our system metrics correctly.
5. Understanding what correct use is means recognising incorrect use – abuse awareness.

When we commit the Crime of Metric Abuse, even unconsciously, we make poor decisions. If we act on those decisions we get an outcome that we do not intend and do not want – we make an error.  Unfortunately, more efficiency does not compensate for less effectiveness – if fact it makes it worse. Efficiency amplifies Effectiveness – “Doing the wrong thing right makes it wronger not righter” as Russell Ackoff succinctly puts it.  Paradoxically our inefficient and bureaucratic systems may be our only defence against our ineffective and potentially dangerous decision making – so before we strip out the bureaucracy and strive for efficiency we had better be sure we are making effective decisions and that means exposing and treating our nasty habit for Metric Abuse.

Metric Abuse manifests in many forms – and there are two that when combined create a particularly virulent addiction – Abuse of Ratios and Abuse of Targets. First let us talk about the Abuse of Ratios.

A ratio is one number divided by another – which sounds innocent enough – and ratios are very useful so what is the danger? The danger is that by combining two numbers to create one we throw away some information. This is not a good idea when making the best possible decision means squeezing every last drop of understanding our of our information. To unconsciously throw away useful information amounts to incompetence; to consciously throw away useful information is negligence because we could and should know better.

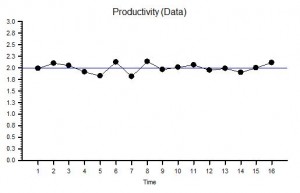
Here is a time-series chart of a process metric presented as a ratio. This is productivity – the ratio of an output to an input – and it shows that our productivity is stable over time.  We started OK and we finished OK and we congratulate ourselves for our good management – yes? Well, maybe and maybe not.  Suppose we are measuring the Quality of the output and the Cost of the input; then calculating our Value-For-Money productivity from the ratio; and then only share this derived metric. What if quality and cost are changing over time in the same direction and by the same rate? The productivity ratio will not change.


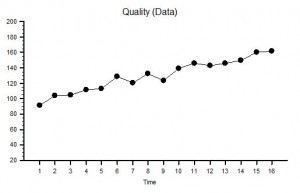
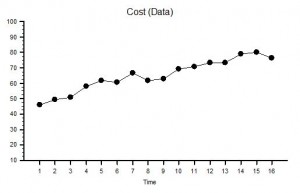
Suppose the raw data we used to calculate our ratio was as shown in the two charts of measured Ouput Quality and measured Input Cost  – we can see immediately that, although our ratio is telling us everything is stable, our system is actually changing over time – it is unstable and therefore it is unpredictable. Systems that are unstable have a nasty habit of finding barriers to further change and when they do they have a habit of crashing, suddenly, unpredictably and spectacularly. If you take your eyes of the white line when driving and drift off course you may suddenly discover a barrier – the crash barrier for example, or worse still an on-coming vehicle! The apparent stability indicated by a ratio is an illusion or rather a delusion. We delude ourselves that we are OK – in reality we may be on a collision course with catastrophe. 

But increasing quality is what we want surely? Yes – it is what we want – but at what cost? If we use the strategy of quality-by-inspection and add extra checking to detect errors and extra capacity to fix the errors we find then we will incur higher costs. This is the story that these Quality and Cost charts are showing.  To stay in business the extra cost must be passed on to our customers in the price we charge: and we have all been brainwashed from birth to expect to pay more for better quality. But what happens when the rising price hits our customers finanical constraint?  We are no longer able to afford the better quality so we settle for the lower quality but affordable alternative.  What happens then to the company that has invested in quality by inspection? It loses customers which means it loses revenue which is bad for its financial health – and to survive it starts cutting prices, cutting corners, cutting costs, cutting staff and eventually – cutting its own throat! The delusional productivity ratio has hidden the real problem until a sudden and unpredictable drop in revenue and profit provides a reality check – by which time it is too late. Of course if all our competitors are committing the same crime of metric abuse and suffering from the same delusion we may survive a bit longer in the toxic mediocrity swamp – but if a new competitor who is not deluded by ratios and who learns how to provide consistently higher quality at a consistently lower price – then we are in big trouble: our customers leave and our end is swift and without mercy. Competition cannot bring controlled improvement while the Abuse of Ratios remains rife and unchallenged.

Now let us talk about the second Metric Abuse, the Abuse of Targets.

The blue line on the Productivity chart is the Target Productivity. As leaders and managers we have bee brainwashed with the mantra that “you get what you measure” and with this belief we commit the crime of Target Abuse when we set an arbitrary target and use it to decide when to reward and when to punish. We compound our second crime when we connect our arbitrary target to our accounting clock and post periodic praise when we are above target and periodic pain when we are below. We magnify the crime if we have a quality-by-inspection strategy because we create an internal quality-cost tradeoff that generates conflict between our governance goal and our finance goal: the result is a festering and acrimonious stalemate. Our quality-by-inspection strategy paradoxically prevents improvement in productivity and we learn to accept the inevitable oscillation between good and bad and eventually may even convince ourselves that this is the best and the only way.  With this life-limiting-belief deeply embedded in our collective unconsciousness, the more enthusiastically this quality-by-inspection design is enforced the more fear, frustration and failures it generates – until trust is eroded to the point that when the system hits a problem – morale collapses, errors increase, checks are overwhelmed, rework capacity is swamped, quality slumps and costs escalate. Productivity nose-dives and both customers and staff jump into the lifeboats to avoid going down with the ship!  

The use of delusional ratios and arbitrary targets (DRATs) is a dangerous and addictive behaviour and should be made a criminal offense punishable by Law because it is both destructive and unnecessary.

With painful awareness of the problem a path to a solution starts to form:

1. Share the numerator, the denominator and the ratio data as time series charts.
2. Only put requirement specifications on the numerator and denominator charts.
3. Outlaw quality-by-inspection and replace with quality-by-design-and-improvement.  

Metric Abuse is a Crime. DRATs are a dangerous addiction. DRATs kill Motivation. DRATs Kill Organisations.

Charts created using BaseLine

Anyone for more Boiled Frog?

There is a famous metaphor for the dangers of denial and complacency called the boiled frog syndrome.

Apparently if you drop a frog into hot water it will notice and jump out  but if you put a frog in water at a comfortable temperature and then slowly heat it up it will not jump out – it does not notice the slowly rising temperature until it is too late – and it boils.

The metaphor is used to highlight the dangers of not being aware enough of our surroundings to notice when things are getting “hot” – which means we do not act in time to prevent a catastrophe.

There is another side to the boiled frog syndrome – and this when improvements are made incrementally by someone else and we do not notice those either. This is the same error of complacency and there is no positive feedback so the improvement investment fizzles out – without us noticing that either.  This is a disadvantage of incremental improvement – we only notice the effect if we deliberately measure at intervals and compare present with past. Not many of us appear to have the foresight or fortitude to do that. We are the engineers of our own mediocrity.

There is an alternative though – it is called improvement-by-design. The difference from improvement-by-increments is that with design you deliberately plan to make a big beneficial change happen quickly – and you can do this by testing the design before implementing it so that you know it is feasible.  When the change is made the big beneficial difference is noticed – WOW! – and everyone notices: supporters and cynics alike.  Their responses are different though – the advocates are jubilant and the cynics are shocked. The cynics worldview is suddenly challenged – and the feeling is one of positive confusion. They say “Wow! That’s a miracle – how did you do that?”.

So when we understand enough to design a change then we should use improvement-by-design; and when we don’t understand enough we have no choice but to do use improvement-by-discovery.

Inborn Errors of Management

There is a group of diseases called “inborn errors of metabolism” which are caused by a faulty or missing piece of DNA – the blueprint of life that we inherit from our parents. DNA is the chemical memory that stores the string of instructions for how to build every living organism – humans included. If just one DNA instruction becomes damaged or missing then we may lose the ability to make or to remove one specific chemical – and that can lead to a deficiency or an excess of other chemicals – which can then lead to dysfunction – which can then make us feel unwell – and can then limit both our quality and quantity of life.  We are a biological system of interdependent parts. If an inborn error of metabolism is lethal it will not be passed on to our offspring because we don’t live long enough – so the ones we see are the ones which and not lethal.  We treat the symptoms of an inborn error of metabolism by artificially replacing the missing chemical – but the way to treat the cause is to repair, replace or remove the faulty DNA.

The same metaphor can be applied to any social system. It too has a form of DNA which is called culture – the inherited set of knowledge, beliefs, attitudes and behaviours that the organisation uses to conduct itself in its day-to-day business of survival. These patterns of behaviour are called memes – the social equivalent to genes – and are passed on from generation to generation through language – body language and symbolic language; spoken words – stories, legends, myths, songs, poems and books – the cultural collective memory of the human bio-psycho-social system. All human organisations share a large number of common memes – just as we share a large number of common genes with other animals and plants and even bacteria. Despite this much larger common cultural heritage – it is the differences rather than the similarities that we notice – and it is these differences that spawn the cultural conflict that we observe at all levels of society.

If, by chance alone, an organisation inherits a depleted set of memes it will appear different to all the others and it will tend to defend that difference rather than to change it. If an organisation has a meme defect, a cultural mutation that affects a management process, then we have the organisational condition called an Inborn Error of Management – and so long as the mutation is not lethal to the organisation it will tend to persist and be passed largely unnoticed from one generation of managers to the next!

The NHS was born in 1948 without a professional management arm, and while it survived and grew initally, it became gradually apparent that the omisson of the professional management limb was a problem; so in the 1980’s, following the Griffiths Report, a large dose professional management was grafted on and a dose of new management memes were injected. These included finance, legal and human resource management memes but one important meme was accidentally omitted – process engineering – the ability to design a process to meet a specific quality, time and cost specification.  This omission was not noticed initially because the rapid development of new medical technologies and new treatments was delivering improvements that obscured the inborn error of management. The NHS became the envy of many other countries – high quality healthcare available to all and free at the point of delivery.  Population longevity improved, public expectation increased, demand for healthcare increased and inevitably the costs increased.  In the 1990’s the growing pains of the burgeoning NHS led to a call for more funding, quoting other countries as evidence, and at the turn of the New Millenium a ten year plan to pump billions of pounds per year into the NHS was hatched.  Unfortunately, the other healthcare services had inherited the same meme defect – so the NHS grew 40% bigger but no better – and the evidence is now accumulatung that productivity (the ratio of output quality to input cost) has actally fallen by more than 10% – there are more people doing more work but less well.  The UK along with many other countries has hit an economic brick wall and the money being sucked into the NHS cannot increase any more – even though we have created a legacy of an increasing proportion of retired and elderly members of society to support. 

The meme defect that the NHS inherited in 1948 and that was not corrected in the transplant operation  1980’s is now exerting it’s influence – the NHS has no capability for process engineering – the theory, techniques, tools and training required to design processes are not on the curriculum of either the NHS managers or the clinicians. The effect of this defect is that we can only treat the symptoms rather than the cause – and we only have blunt and ineffective instruments such as a budget restriction – the management equivalent of a straight jacket – and budget cuts – the management equivalent of a jar of leeches. To illustrate the scale of the effect of this inborn error of management we only need to look at other organisations that do not appear to suffer from the same condition – for example the electronics manufacturing industry. The almost unbelieveable increase in the performance, quality and value for money of modern electronics over the last decade (mobile phones, digital cameras, portable music players, laptop computers, etc) is because these industries have invested in developing both their electrical and process engineering capabilities. The Law of the Jungle has weeded out the companies who did not – they have gone out of business or been absorbed – but publically funded service organisations like the NHS do not have this survival pressure – they are protected from it – and trying to simulate competition with an artificial internal market and applying stick-and-carrot top-down target-driven management is not a like-for-like replacement.    

The challenge for the NHS is clear – if we want to continue to enjoy high quality health care, free at the point of delivery, and that we can afford then we will need to recognise and correct our inborn error of management. If we ignore the symptoms, deny the diagnosis and refuse to take the medicine then we will suffer a painful and lingering decline – not lethal and not enjoyable – and it is has a name: purgatory.

The good news is that the treatment is neither expensive, nor unpleasant nor dangerous – process engineering is easy to learn, quick to apply, and delivers results almost immediately – and it can be incorporated into the organisational meme-pool quite quickly by using the see-do-teach vector. All we have to do is to own up to the symptoms, consider the evidence, accept the diagnosis, recognise the challenge and take our medicine. The sooner the better!


Lies, Damned Lies and Statistics!

Most people are confused by statistics and because of this experts often regard them as ignorant, stupid or both.  However, those who claim to be experts in statistics need to proceed with caution – and here is why.

The people who are confused by statistics are confused for a reason – the statistics they see presented do not make sense to them in their world.  They are not stupid – many are graduates and have high IQ’s – so this means they must be ignorant and the obvious solution is to tell them to go and learn statistics. This is the strategy adopted in medicine: Trainees are expected to invest some time doing research and in the process they are expected to learn how to use statistics in order to develop their critical thinking and decision making.  So far so good, so what  is the outcome?

Well, we have been running this experiment for decades now – there are millions of peer reviewed papers published – each one having passed the scrutiny of a statistical expert – and yet we still have a health care system that is not delivering what we need at a cost we can afford.  So, there must be someone else at fault – maybe the managers! They are not expected to learn or use statistics so that statistically-ignorant rabble must be the problem -so the next plan is “Beat up the managers” and “Put statistically trained doctors in charge”.

Hang on a minute! Before we nail the managers and restructure the system let us step back and consider another more radical hypothesis. What if there is something not right about the statistics we are using? The medical statistics experts will rise immediately and state “Research statistics is a rigorous science derived from first principles and is mathematically robust!”  They are correct. It is. But all mathematical derivations are based on some initial fundamental assumptions so when the output does not seem to work in all cases then it is always worth re-examining the initial assumptions. That is the tried-and-tested path to new breakthroughs and new understanding.

The basic assumption that underlies research statistics is that all measurements are independent of each other which also implies that order and time can be ignored.  This is the reason that so much effort, time and money is invested in the design of a research trial – to ensure that the statistical analysis will be correct and the conclusions will be valid. In other words the research trial is designed around the statistical analysis method and its founding assumption. And that is OK when we are doing research.

However, when we come to apply the output of our research trials to the Real World we have a problem.

How do we demonstrate that implementing the research recommendation has resulted in an improvement? We are outside the controlled environment of research now and we cannot distort the Real World to suit our statistical paradigm.  Are the statistical tools we used for the research still OK? Is the founding assumption still valid? Can we still ignore time? Our answer is clearly “NO” because we are looking for a change over time! So can we assume the measurements are independent – again our answer is “NO” because for a process the measurement we make now is influenced by the system before, and the same system will also influence the next measurement. The measurements are NOT independent of each other.

Our statistical paradigm suddenly falls apart because the founding assumption on which it is built is no longer valid. We cannot use the statistics that we used in the research when we attempt to apply the output of the research to the Real World. We need a new and complementary statistical approach.

Fortunately for us it already exists and it is called improvement statistics and we use it all the time – unconsciously. No doctor would manage the blood pressure of a patient on Ward A  based on the average blood pressure of the patients on Ward B – it does not make sense and would not be safe.  This single flash of insight is enough to explain our confusion. There is more than one type of statistics!

New insights also offer new options and new actions. One action would be that the Academics learn improvement statistics so that they can understand better the world outside research; another action would be that the Pragmatists learn improvement statistics so that they can apply the output of well-conducted research in the Real World in a rational, robust and safe way. When both groups have a common language the opportunities for systemic improvment increase. 

BaseLine© is a tool designed specifically to offer the novice a path into the world of improvement statistics.

Reactive or Proactive?

Improvement Science is about solving problems – so looking at how we solve problems is a useful exercise – and there is a continuous spectrum from 100% reactive to 100% proactive.

The reactive paradigm implies waiting until the problem is real and urgent and then acting quickly and decisively – hence the picture of the fire-fighter.  Observe the equipment that the fire-fighter needs:  a hat and suit to keep him safe and a big axe! It is basically a destructive and unsafe job based on the “our purpose is to stop the problem getting worse”.

The proactive paradigm implies looking for the earliest signs of the problem and planning the minimum action required to prevent the problem – hence the picture of the clinician. Observe the equipment that the clinician needs: a clean white coat to keep her patients safe and a stethoscope – a tool designed to increase her sensitivity so that subtle diagnostic sounds can be detected.

If we never do the proactive we will only ever do the reactive – and that is destructive and unsafe. If we never do the reactive we run the risk of losing everything – and that is destructive and unsafe too.

To practice safe and effective Improvement Science we must be able to do both in any combination and know which and when: we need to be impatient, decisive and reactive when a system is unstable, and we need to be patient, reflective and proactive when the system is stable.  To choose our paradigm we must listen to the voice of the process. It will speak to us if we are prepared to listen and if we are prepared to learn it’s language.

Is it OK to Fail First Time?

Improvement Science is about learning from when what actually happens is different to that which we expected to happen.  Is this surprise a failure or is this a success? It depends on our perspective. If we always get what we expect then we could conclude that we have succeeded – yet we have neither learned anything nor improved. So have we failed to learn? In contrast, if we never get what we expected then we could conclude that we  always fail – yet we do not report what we have learned and improved.  Our expectation might be too high! So comparing outcome with expectation seems a poor way to measure our progress with learning and improvement.

When we try something new we should expect to be surprised – otherwise it would not be new.  It is what we learn from that expected surprise that is of most value. Sometime life turns out better than we expected – what can we learn from those experiences and how can we ensure that outcome happens again – predictably? Sometimes life turns out worse than we expected – what can we learn from those experiences and how can we ensure that outcome does not happen again, predictably?  So, yes it is OK for us to fail and to not get what we expected – first time.  What is not OK is for us to fail to learn from the lesson and to make an avoidable mistake more than once or miss an opportunity for improvement more than once.

Do We have a Wealth of Data and a Dearth of Information?

Sustained improvement only follows from effective actions; which follow from well-informed decisions – not from blind guessing.  A well-informed decision imples good information – and good information is not just good data. Good information implies that good data is presented in a format that is both undistorted and meaningful to the recipient.  How we present data is, in my experience, one of the weakest links in the improvement process.  We rarely see data presented in a clear, undistorted, and informative way and commonly we see it presented in a way that obscures or distorts our perception of reality. We are presented with partial facts quoted without context – so we unconsciously fill in the gaps with our own assumptions and prejudices and in so doing distort our perception further.  And the more emotive the subject the more durable the memory that we create – which means it continues to distort our future perception even more.

The primary purpose of the news media is survival – by selling news – so the more emotive and memorable the news the better it sells.  Accuracy and completeness can render news less attractive: by generating the “that’s obvious, it is not news” response.  Catchy headlines sell news and to do that they need to generate a specific emotional reaction quickly – and that emotion is curiosity! Once alerted, they must hold the readers attention by quickly creating a sense of drama and suspense – like a good joke – by being just ambiguous enough to resonate with many different pepole – playing on their prejudices to build the emotional intensity.

The purpose of politicians is survival – to stay in power long enough to achieve their goals – so the less negative press they attract the better – but Politicians and the Press need each other because their purpose is the same – to survive by selling an idea to the masses – and to do that they must distort reality and create ambiguity.  This has the unfortunate side effect of also generating less-than-wise decisions.

So if our goal is to cut through the emotive fog and get to a good decision quickly so that we can act effectively we need just the right data presented in context and in an unambiguous format that we, the decision-maker, can interpret quickly. The most accessible format is as a picture that tells a story – the past, the present and the likely future – a future that is shaped by the actions that come from the decisions we make in the present that we make using information from the past.  The skill is to convert data into a story … and one simple and effective tool for doing that is a process behaviour chart.

What Happens if We Cut the Red Tape?

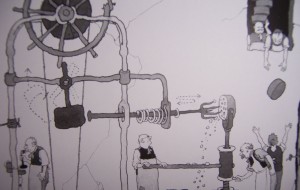
Later in his career, the famous artist William Heath-Robinson (1872-1944) created works of great ingenuity that showed complex inventions that were created to solve real everyday problems.  The genius of his work was that his held-together-with-string contraptions looked comically plausible. This genre of harmless mad-inventorism has endured, for example as the eccentric Wallace and Grommet characters.

The problem arises when this seat-of-the-pants incremental invent-patch-and-fix approach is applied to real systems – in particular a healthcare system. We end up with the same result – a Heath-Robinson contraption that is held together with Red Tape.

The complex bureaucracy both holds the system together and clogs up the working – and everyone knows it. It is not harmless though – it is expensive, slow and lethal.  How then do we remove the Red Tape to allow the machine to work more quickly, more safely and more affordably – without the whole contraption falling apart?

A good first step would be to stop adding yet more Red Tape. A sensible next step would be to learn how to make the Red Tap redundant before removing it. However, if we knew how to do that already we would not have let the Red Tapeworms infest our healthcare system in the first place!  This uncomfortable conclusion raises some questions …

What insight, knowledge and skill are we missing?
Where do we need to look to find the skills we lack?
Who knows how to safely eliminate the Red Tapeworms?
Can they teach the rest of us?
How long will it take us to learn and apply the knowledge?
Why might we justify continuing as we are?
Why might we want to maintain the status quo?
Why might we ignore the symptoms and not seek advice?
What are we scared of? Having to accept some humility?

That doesn’t sound like a large price to pay for improvement!

To Push or Not to Push? Is that the Question?

Improvement implies change;

… change implies learning;

… learning implies asking questions;

… and asking questions implies listening with both humility and confidence.

The humility of knowing that their are many things we do not yet understand; and the confidence of knowing that there are many ways we can grow our understanding.

Change is a force – and when we apply a force to a system we meet resistance.

The natural response to feeling resistance is to push harder; and when we do that the force of resistance increases. With each escalation the amount of effort required for both sides to maintain the stalemate increases and the outcome of the trial is decided by the strength and stamina of the protagonists.

One may break, tire or give up …. eventually.

The counter-intuitive reaction to meeting resistance is to push less and to learn more; and it is more effective strategy.


We can observe this principle in the behaviour of a system that is required to deliver a specific performance – such as a delivery time.  The required performance is often labelled a “target” and is usually enforced with a carrot-flavoured-stick wrapped in a legal contract.

The characteristic sign on the performance chart of pushing against an immovable target is the Horned Gaussian – the natural behaviour of the system painfully distorted by the target.

Our natural reaction is to push harder; and initially we may be rewarded with some progress.  And with a Herculean effort we may actually achieve the target – though at what cost?

Our front-line fighters are engaged in a never-ending trial of strength, holding back the Horn that towers over them and that threatens to tip over the target at any moment.

The effort, time, and money expended is out of all proportion to the improvement gained and just maintaining the status quo is exhausting.

Our unconscious belief is that if we weather the storm and push hard enough we will “break” the resistance, and after that it will be plain sailing. This strategy might work in the affairs of Man – it doesn’t work with Nature.

We won’t break the Laws of Nature by pushing harder. They will break us.

So, consider what might happen if we did the opposite?

When we feel resistance we pull back a bit; we ask questions; we seek to see from the opposite perspective and to broaden our own perspective; we seek to expand our knowledge and to deepen our understanding.

When we redirect our effort, time and money into understanding the source of the resistance we uncover novel options; we get those golden “eureka!” moments that lead to synergism rather than to antagonism; to win-win rather than lose-lose outcomes.

Those options were there all along – they were just not visible with our push mindset.

Change is a force – so “May the 4th be with you“.