Resilience

The rise in the use of the term “resilience” seems to mirror the sense of an accelerating pace of change. So, what does it mean? And is the meaning evolving over time?

One sense of the meaning implies a physical ability to handle stresses and shocks without breaking or failing. Flexible, robust and strong are synonyms; and opposites are rigid, fragile, and weak.

So, digging a bit deeper we know that strong implies an ability to withstand extreme stress while resilient implies the ability to withstanding variable stress. And the opposite of resilient is brittle because something can be both strong and brittle.

This is called passive resilience because it is an inherent property and cannot easily be changed. A ball is designed to be resilient – it will bounce back – and this inherent in the material and the structure. The implication of this is that to improve passive resilience we would need to remove and to replace with something better suited to the range of expected variation.

The concept of passive resilience applies to processes as well, and a common manifestation of a brittle process is one that has been designed using averages.

Processes imply flows. The flow into a process is called demand, while the flow out of the process is called activity. What goes in must come out, so if the demand exceeds the activity then a backlog will be growing inside the process. This growing queue creates a number of undesirable effects – first it takes up space, and second it increases the time for demand to be converted into activity. This conversion time is called the lead-time.

So, to avoid a growing queue and a growing wait, there must be sufficient flow-capacity at each and every step along the process. The obvious solution is to set the average flow-capacity equal to the average demand; and we do this because we know that more flow-capacity implies more cost – and to stay in business we must keep a lid on costs!

This sounds obvious and easy but does it actually work in practice?

The surprising answer is “No”. It doesn’t.

What happens in practice is that the measured average activity is always less than the funded flow-capacity, and so less than the demand. The backlogs will continue to grow; the lead-time will continue to grow; the waits will continue to grow; the internal congestion will continue to grow – until we run out of space. At that point everything can grind to a catastrophic halt. That is what we mean by a brittle process.

This fundamental and unexpected result can easily and quickly be demonstrated in a concrete way on a table top using ordinary dice and tokens. A credible game along these lines was described almost 40 years ago in The Goal by Eli Goldratt, originator of the school of improvement called Theory of Constraints. The emotional impact of gaining this insight can be profound and positive because it opens the door to a way forward which avoids the Flaw of Averages trap. There are countless success stories of using this understanding.
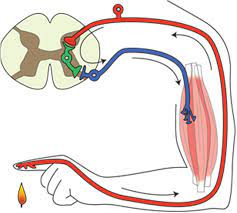

So, when we need to cope with variation and we choose a passive resilience approach then we have to plan to the extremes of the range of variation. Sometimes that is not possible and we are forced to accept the likelihood of failure. Or we can consider a different approach.

Reactive resilience is one that living systems have evolved to use extensively, and is illustrated by the simple reflex loop shown in the diagram.

A reactive system has three components linked together – a sensor (i.e. temperature sensitive nerves endings in the skin), a processor (i.e. the grey matter of the spinal chord) and an effector (i.e. the muscle, ligaments and bones). So, when a pre-defined limit of variation is reached (e.g. the flame) then the protective reaction withdraws the finger before it becomes damaged. The advantage this type of reactive resilience is that it is relatively simple and relatively fast. The disadvantage is that it is not addressing the cause of the problem.

This is called reactive, automatic and agnostic.

The automatic self-regulating systems that we see in biology, and that we have emulated in our machines, are evidence of the effectiveness of a combination of passive and reactive resilience. It is good enough for most scenarios – so long as the context remains stable. The problem comes when the context is evolving, and in that case the automatic/reflex/blind/agnostic approach will fail – at some point.


Survival in an evolving context requires more – it requires proactive resilience.

What that means is that the processor component of the feedback loop gains an extra feature – a memory. The advantage this brings is that past experience can be recalled, reflected upon and used to guide future expectation and future behaviour. We can listen and learn and become proactive. We can look ahead and we can keep up with our evolving context. One might call, this reactive adaptation or co-evolution and it is a widely observed phenomenon in nature.

The usual manifestation is this called competition.

Those who can reactively adapt faster and more effectively than others have a better chance of not failing – i.e. a better chance of survival. The traditional term for this is survival of the fittest but the trendier term for proactive resilience is agile.
And that is what successful organisations are learning to do. They are adding a layer of proactive resilience on top of their reactive resilience and their passive resilience.

All three layers of resilience are required to survive in an evolving context.

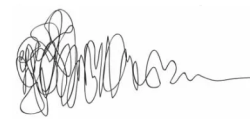
One manifestation of this is the concept of design which is where we create things with the required resilience before they are needed. This is illustrated by the design squiggle which has time running left to right and shows the design evolving adaptively until there is sufficient clarity to implement and possibly automate.

And one interesting thing about design is that it can be done without an understanding of how something works – just knowing what works is enough. The elegant and durable medieval cathedrals were designed and built by Master builders who had no formal education. They learned the heuristics as apprentices and through experience.


And if we project the word game forwards we might anticipate a form of resilience called proactive adaptation. However, we sense that is a novel thing because there is no proadaptive word in the dictionary.

PS. We might also use the term Anti-Fragile, which is the name of a thought-provoking book that explores this very topic.

Pushmepullyu

The pushmepullyu is a fictional animal immortalised in the 1960’s film Dr Dolittle featuring Rex Harrison who learned from a parrot how to talk to animals.  The pushmepullyu was a rare, mysterious animal that was never captured and displayed in zoos. It had a sharp-horned head at both ends and while one head slept the other stayed awake so it was impossible to sneak up on and capture.

The spirit of the pushmepullyu lives on in Improvement Science as Push-Pull and remains equally mysterious and difficult to understand and explain. It is confusing terminology. So what does Push-Pull acually mean?

To decode the terminology we need to first understand a critical metric of any process – the constraint cycle time (CCT) – and to do that we need to define what the terms constraint and cycle time mean.

Consider a process that comprises a series of steps that must be completed in sequence.  If we put one task through the process we can measure how long each step takes to complete its contribution to the whole task.  This is the touch time of the step and if the resource is immediately available to start the next task this is also the cycle time of the step.

If we now start two tasks at the same time then we will observe when an upstream step has a longer cycle time than the next step downstream because it will shadow the downstream step. In contrast, if the upstream step has a shorter cycle time than the next step down stream then it will expose the downstream step. The differences in the cycle times of the steps will determine the behaviour of the process.

Confused? Probably.  The description above is correct BUT hard to understand because we learn better from reality than from rhetoric; and we find pictures work better than words.  Pragmatic comes before academic; reality before theory.  We need a realistic example to learn from.

Suppose we have a process that we are told has three steps in sequence, and when one task is put through it takes 30 mins to complete.  This is called the lead time and is an important process output metric. We now know it is possible to complete the work in 30 mins so we can set this as our lead time expectation.  

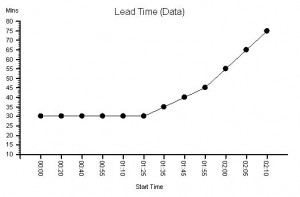
Suppose we plot a chart of lead times in the order that the tasks start and record the start time and lead time for each one – and we get a chart that looks like this. It is called a lead time run chart.  The first six tasks complete in 30 mins as expected – then it all goes pear-shaped. But why?  The run chart does not tell  us the reason – it just alerts us to dig deeper. 

The clue is in the run chart but we need to know what to look for.  We do not know how to do that yet so we need to ask for some more data.

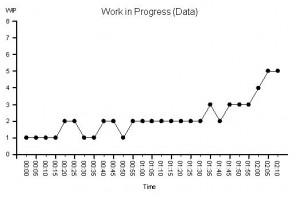
We are given this run chart – which is a count of the number of tasks being worked on recorded at 5 minute intervals. It is the work in progress run chart.

We know that we have a three step process and three separate resources – one for each step. So we know that that if there is a WIP of less than 3 we must have idle resources; and if there is a WIP of more than 3 we must have queues of tasks waiting.

We can see that the WIP run chart looks a bit like the lead time run chart.  But it still does not tell us what is causing the unstable behaviour.

In fact we do already have all the data we need to work it out but it is not intuitively obvious how to do it. We feel we need to dig deeper.

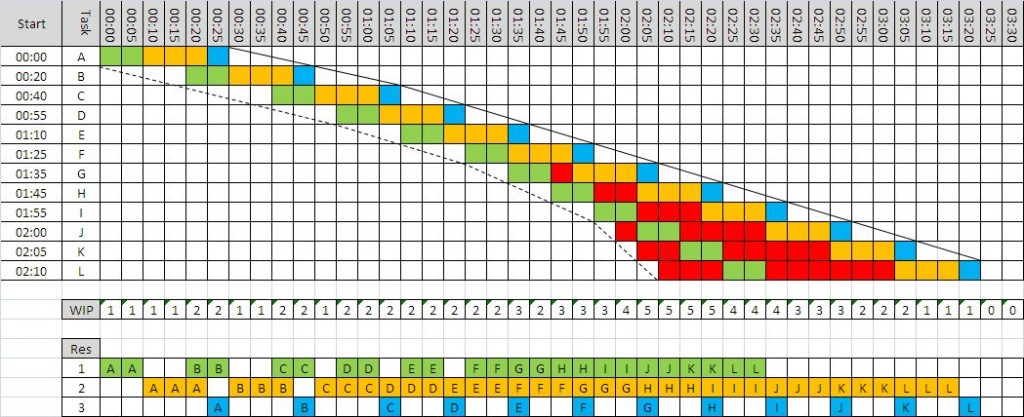
 We decide to go and see for ourselves and to observe exactly what happens to each of the twelve tasks and each of the three resources. We use these observations to draw a Gantt chart.

Now we can see what is happening.

We can see that the cycle time of Step 1 (green) is 10 mins; the cycle time for Step 2 (amber) is 15 mins; and the cycle time for Step 3 (blue) is 5 mins.


This explains why the minimum lead time was 30 mins: 10+15+5 = 30 mins. OK – that makes sense now.

Red means tasks waiting and we can see that a lead time longer than 30 mins is associated with waiting – which means one or more queues.  We can see that there are two queues – the first between Step 1 and Step 2 which starts to form at Task G and then grows; and the second before Step 1 which first appears for Task J  and then grows. So what changes at Task G and Task J?

Looking at the chart we can see that the slope of the left hand edge is changing – it is getting steeper – which means tasks are arriving faster and faster. We look at the interval between the start times and it confirms our suspicion. This data was the clue in the original lead time run chart. 

Looking more closely at the differences between the start times we can see that the first three arrive at one every 20 mins; the next three at one every 15 mins; the next three at one every 10 mins and the last three at one every 5 mins.

Ah ha!

Tasks are being pushed  into the process at an increasing rate that is independent of the rate at which the process can work.     

When we compare the rate of arrival with the cycle time of each step in a process we find that one step will be most exposed – it is called the constraint step and it is the step that controls the flow in the whole process. The constraint cycle time is therefore the critical metric that determines the maximum flow in the whole process – irrespective of how many steps it has or where the constraint step is situated.

If we push tasks into the process slower than the constraint cycle time then all the steps in the process will be able to keep up and no queues will form – but all the resources will be under-utilised. Tasks A to C;

If we push tasks into the process faster than the cycle time of any step then queues will grow upstream of these multiple constraint steps – and those queues will grow bigger, take up space and take up time, and will progressively clog up the resources upstream of the constraints while starving those downstream of work. Tasks G to L.

The optimum is when the work arrives at the same rate as the cycle time of the constraint – this is called pull and it means that the constraint is as the pacemaker and used to pull the work into the process. Tasks D to F.

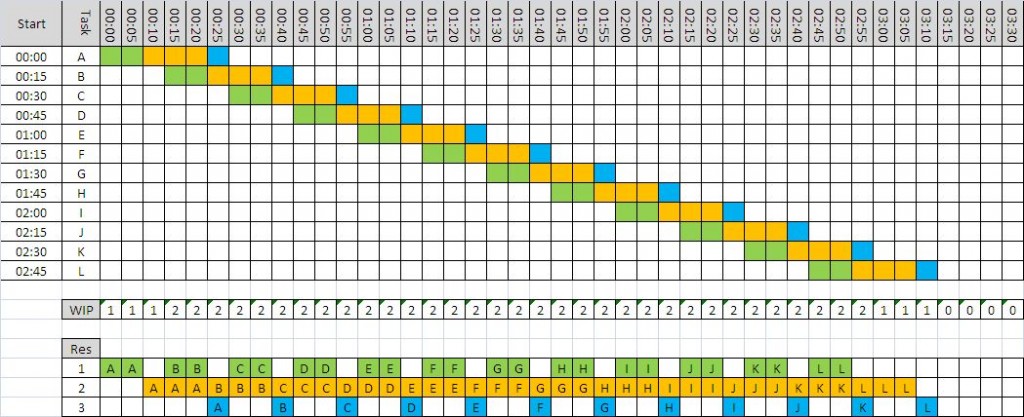
With this new understanding we can see that the correct rate to load this process is one task every 15 mins – the cycle time of Step 2.

We can use a Gantt chart to predict what would happen.

The waiting is eliminated, the lead time is stable and meeting our expectation, and when task B arrives thw WIP is 2 and stays stable.

In this example we can see that there is now spare capacity at the end for another task – we could increase our productivity; and we can see that we need less space to store the queue which also improves our productivity.  Everyone wins. This is called pull scheduling.  Pull is a more productive design than push. 

To improve process productivity it is necessary to measure the sequence and cycle time of every step in the process.  Without that information it is impossible to understand and rationally improve our process.     

BUT in reality we have to deal with variation – in everything – so imagine how hard it is to predict how a multi-step process will behave when work is being pumped into it at a variable rate and resources come and go! No wonder so many processes feel unpredictable, chaotic, unstable, out-of-control and impossible to both understand and predict!

This feeling is an illusion because by learning and using the tools and techniques of Improvement Science it is possible to design and predict-within-limits how these complex systems will behave.  Improvement Science can unravel this Gordian knot!  And it is not intuitively obvious. If it were we would be doing it.

Safety-By-Design

The picture is of Elisha Graves Otis demonstrating, in the mid 19th century, his safe elevator that automatically applies a brake if the lift cable breaks. It is a “simple” fail-safe mechanical design that effectively created the elevator industry and the opportunity of high-rise buildings.

“To err is human” and human factors research into how we err has revealed two parts – the Error of Intention (poor decision) and the Error of Execution (poor delivery) – often referred to as “mistakes” and “slips”.

Most of the time we act unconsciously using well practiced skills that work because most of our tasks are predictable; walking, driving a car etc.

The caveman wetware between our ears has evolved to delegate this uninteresting and predictable work to different parts of the sub-conscious brain and this design frees us to concentrate our conscious attention on other things.

So, if something happens that is unexpected we may not be aware of it and we may make a slip without noticing. This is one way that process variation can lead to low quality – and these are the often the most insidious slips because they go unnoticed.

It is these unintended errors that we need to eliminate using safe process design.

There are two ways – by designing processes to reduce the opportunity for mistakes (i.e. improve our decision making); and then to avoid slips by designing the subsequent process to be predictable and therefore suitable for delegation.

Finally, we need to add a mechanism to automatically alert us of any slips and to protect us from their consequences by failing-safe.  The sign of good process design is that it becomes invisible – we are not aware of it because it works at the sub-conscious level.

As soon as we become aware of the design we have either made a slip – or the design is poor.


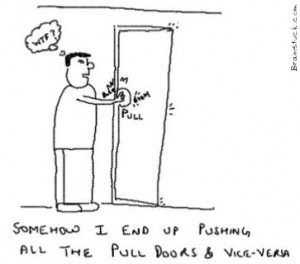
Suppose we walk up to a door and we are faced with a flat metal plate – this “says” to us that we need to “push” the door to open it – it is unambiguous design and we do not need to invoke consciousness to make a push-or-pull decision.  The technical term for this is an “affordance”.

In contrast a door handle is an ambiguous design – it may require a push or a pull – and we either need to look for other clues or conduct a suck-it-and-see experiment. Either way we need to switch our conscious attention to the task – which means we have to switch it away from something else. It is those conscious interruptions that cause us irritation and can spawn other, possibly much bigger, slips and mistakes.

Safe systems require safe processes – and safe processes mean fewer mistakes and fewer slips. We can reduce slips through good design and relentless improvement.

A simple and effective tool for this is The 4N Chart® – specifically the “niggle” quadrant.

Whenever we are interrupted by a poorly designed process we experience a niggle – and by recording what, where and when those niggles occur we can quickly focus our consciousness on the opportunity for improvement. One requirement to do this is the expectation and the discipline to record niggles – not necessarily to fix them immediately – but just to record them and to review them later.

In his book “Chasing the Rabbit” Steven Spear describes two examples of world class safety: the US Nuclear Submarine Programme and Alcoa, an aluminium producer.  Both are potentially dangerous activities and, in both examples, their world class safety record came from setting the expectation that all niggles are recorded and acted upon – using a simple, effective and efficient niggle-busting process.

In stark and worrying contrast, high-volume high-risk activities such as health care remain unsafe not because there is no incident reporting process – but because the design of the report-and-review process is both ineffective and inefficient and so is not used.

The risk of avoidable death in a modern hospital is quoted at around 1:300 – if our risk of dying in an elevator were that high we would take the stairs!  This worrying statistic is to be expected though – because if we lack the organisational capability to design a safe health care delivery process then we will lack the organisational capability to design a safe improvement process too.

Our skill gap is clear – we need to learn how to improve process safety-by-design.


Download Design for Patient Safety report written by the Design Council.

Other good examples are the WHO Safer Surgery Checklist, and the story behind this is told in Dr Atul Gawande’s Checklist Manifesto.

Low-Tech-Toc

Beware the Magicians who wave High Technology Wands and promise Miraculous Improvements if you buy their Black Magic Boxes!

If a Magician is not willing to open the box and show you the inner workings then run away – quickly.  Their story may be true, the Miracle may indeed be possible, but if they cannot or will not explain HOW the magic trick is done then you will be caught in their spell and will become their slave forever.

Not all Magicians have honourable intentions – those who have been seduced by the Dark Side will ensnare you and will bleed you dry like greedy leeches!

In the early 1980’s a brilliant innovator called Eli Goldratt created a Black Box called OPT that was the tangible manifestation of his intellectual brainchild called ToC – Theory of Constraints. OPT was a piece of complex computer software that was intended to rescue manufacturing from their ignorance and to miraculously deliver dramatic increases in profit. It didn’t.

Eli Goldratt was a physicist and his Black Box was built on strong foundations of Process Physics – it was not Snake Oil – it did work.  The problem was that it did not sell: Not enough people believed his claims and those who did discovered that the Black Box was not as easy to use as the Magician suggested.  So Eli Goldratt wrote a book called The Goal in which he explained, in parable form, the Principles of ToC and the theoretical foundations on which his Black Box was built.  The book was a big success but his Black Box still did not sell; just an explanation of how his Black Box worked was enough for people to apply the Principles of ToC and to get dramatic results. So, Eli abandoned his plan of making a fortune selling Black Boxes and set up the Goldratt Institute to disseminate the Principles of ToC – which he did with considerably more success. Eli Goldratt died in June 2011 after a short battle with cancer and the World has lost a great innovator and a founding father of Improvement Science. His legacy lives on in the books he wrote that chart his personal journey of discovery.

The Principles of ToC are central both to process improvement and to process design.  As Eli unintentionally demonstrated, it is more effective and much quicker to learn the Principles of ToC pragmatically and with low technology – such as a book – than with a complex, expensive, high technology Black Box.  As many people have discovered – adding complex technology to a complex problem does not create a simple solution! Many processes are relatively uncomplicated and do not require high technology solutions. An example is the challenge of designing a high productivity schedule when there is variation in both the content and the volume of the work.

If our required goal is to improve productivity (or profit) then we want to improve the throughput and/or to reduce the resources required. That is relatively easy when there is no variation in content and no variation in volume – such as when we are making just one product at a constant rate – like a Model-T Ford in Black! Add some content and volume variation and the challenge becomes a lot trickier! From the 1950’s the move from mass production to mass customisation in the automobile industry created this new challenge and spawned a series of  innovative approaches such as the Toyota Production System (Lean), Six Sigma and Theory of Constraints.  TPS focussed on small batches, fast changeovers and low technology (kanbans or cards) to keep inventory low and flow high; Six Sigma focussed on scientifically identifying and eliminating all sources of variation so that work flows smoothly and in “statistical control”; ToC focussed on identifying the “constraint steps” in the system and then on scheduling tasks so that the constraints never run out of work.

When applied to a complex system of interlinked and interdependent processes the ToC method requires a complicated Black Box to do the scheduling because we cannot do it in our heads. However, when applied to a simpler system or to a part of a complex system it can be done using a low technology method called “paper and pen”. The technique is called Template Scheduling and there is a real example in the “Three Wins” book where the template schedule design was tested using a computer simulation to measure the resilience of the design to natural variation – and the computer was not used to do the actual scheduling. There was no Black Box doiung the scheduling. The outcome of the design was a piece of paper that defined the designed-and-tested template schedule: and the design testing predicted a 40% increase in throughput using the same resources. This dramatic jump in productivity might be regarded as  “miraculous” or even “impossible” but only to someone who was not aware of the template scheduling method. The reality is that that the designed schedule worked just as predicted – there was no miracle, no magic, no Magician and no Black Box.

The Crime of Metric Abuse

We live in a world that is increasingly intolerant of errors – we want everything to be right all the time – and if it is not then someone must have erred with deliberate intent so they need to be named, blamed and shamed! We set safety standards and tough targets; we measure and check; and we expose and correct anyone who is non-conformant. We accept that is the price we must pay for a Perfect World … Yes? Unfortunately the answer is No. We are deluded. We are all habitual criminals. We are all guilty of committing a crime against humanity – the Crime of Metric Abuse. And we are blissfully ignorant of it so it comes as a big shock when we learn the reality of our unconscious complicity.

You might want to sit down for the next bit.

First we need to set the scene:
1. Sustained improvement requires actions that result in irreversible and beneficial changes to the structure and function of the system.
2. These actions require making wise decisions – effective decisions.
3. These actions require using resources well – efficient processes.
4. Making wise decisions requires that we use our system metrics correctly.
5. Understanding what correct use is means recognising incorrect use – abuse awareness.

When we commit the Crime of Metric Abuse, even unconsciously, we make poor decisions. If we act on those decisions we get an outcome that we do not intend and do not want – we make an error.  Unfortunately, more efficiency does not compensate for less effectiveness – if fact it makes it worse. Efficiency amplifies Effectiveness – “Doing the wrong thing right makes it wronger not righter” as Russell Ackoff succinctly puts it.  Paradoxically our inefficient and bureaucratic systems may be our only defence against our ineffective and potentially dangerous decision making – so before we strip out the bureaucracy and strive for efficiency we had better be sure we are making effective decisions and that means exposing and treating our nasty habit for Metric Abuse.

Metric Abuse manifests in many forms – and there are two that when combined create a particularly virulent addiction – Abuse of Ratios and Abuse of Targets. First let us talk about the Abuse of Ratios.

A ratio is one number divided by another – which sounds innocent enough – and ratios are very useful so what is the danger? The danger is that by combining two numbers to create one we throw away some information. This is not a good idea when making the best possible decision means squeezing every last drop of understanding our of our information. To unconsciously throw away useful information amounts to incompetence; to consciously throw away useful information is negligence because we could and should know better.

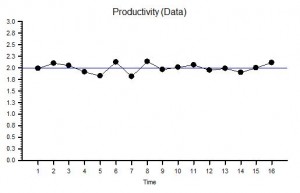
Here is a time-series chart of a process metric presented as a ratio. This is productivity – the ratio of an output to an input – and it shows that our productivity is stable over time.  We started OK and we finished OK and we congratulate ourselves for our good management – yes? Well, maybe and maybe not.  Suppose we are measuring the Quality of the output and the Cost of the input; then calculating our Value-For-Money productivity from the ratio; and then only share this derived metric. What if quality and cost are changing over time in the same direction and by the same rate? The productivity ratio will not change.


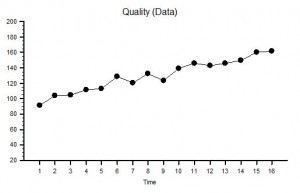
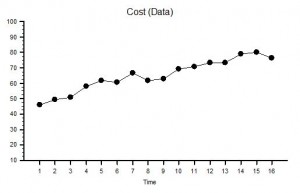
Suppose the raw data we used to calculate our ratio was as shown in the two charts of measured Ouput Quality and measured Input Cost  – we can see immediately that, although our ratio is telling us everything is stable, our system is actually changing over time – it is unstable and therefore it is unpredictable. Systems that are unstable have a nasty habit of finding barriers to further change and when they do they have a habit of crashing, suddenly, unpredictably and spectacularly. If you take your eyes of the white line when driving and drift off course you may suddenly discover a barrier – the crash barrier for example, or worse still an on-coming vehicle! The apparent stability indicated by a ratio is an illusion or rather a delusion. We delude ourselves that we are OK – in reality we may be on a collision course with catastrophe. 

But increasing quality is what we want surely? Yes – it is what we want – but at what cost? If we use the strategy of quality-by-inspection and add extra checking to detect errors and extra capacity to fix the errors we find then we will incur higher costs. This is the story that these Quality and Cost charts are showing.  To stay in business the extra cost must be passed on to our customers in the price we charge: and we have all been brainwashed from birth to expect to pay more for better quality. But what happens when the rising price hits our customers finanical constraint?  We are no longer able to afford the better quality so we settle for the lower quality but affordable alternative.  What happens then to the company that has invested in quality by inspection? It loses customers which means it loses revenue which is bad for its financial health – and to survive it starts cutting prices, cutting corners, cutting costs, cutting staff and eventually – cutting its own throat! The delusional productivity ratio has hidden the real problem until a sudden and unpredictable drop in revenue and profit provides a reality check – by which time it is too late. Of course if all our competitors are committing the same crime of metric abuse and suffering from the same delusion we may survive a bit longer in the toxic mediocrity swamp – but if a new competitor who is not deluded by ratios and who learns how to provide consistently higher quality at a consistently lower price – then we are in big trouble: our customers leave and our end is swift and without mercy. Competition cannot bring controlled improvement while the Abuse of Ratios remains rife and unchallenged.

Now let us talk about the second Metric Abuse, the Abuse of Targets.

The blue line on the Productivity chart is the Target Productivity. As leaders and managers we have bee brainwashed with the mantra that “you get what you measure” and with this belief we commit the crime of Target Abuse when we set an arbitrary target and use it to decide when to reward and when to punish. We compound our second crime when we connect our arbitrary target to our accounting clock and post periodic praise when we are above target and periodic pain when we are below. We magnify the crime if we have a quality-by-inspection strategy because we create an internal quality-cost tradeoff that generates conflict between our governance goal and our finance goal: the result is a festering and acrimonious stalemate. Our quality-by-inspection strategy paradoxically prevents improvement in productivity and we learn to accept the inevitable oscillation between good and bad and eventually may even convince ourselves that this is the best and the only way.  With this life-limiting-belief deeply embedded in our collective unconsciousness, the more enthusiastically this quality-by-inspection design is enforced the more fear, frustration and failures it generates – until trust is eroded to the point that when the system hits a problem – morale collapses, errors increase, checks are overwhelmed, rework capacity is swamped, quality slumps and costs escalate. Productivity nose-dives and both customers and staff jump into the lifeboats to avoid going down with the ship!  

The use of delusional ratios and arbitrary targets (DRATs) is a dangerous and addictive behaviour and should be made a criminal offense punishable by Law because it is both destructive and unnecessary.

With painful awareness of the problem a path to a solution starts to form:

1. Share the numerator, the denominator and the ratio data as time series charts.
2. Only put requirement specifications on the numerator and denominator charts.
3. Outlaw quality-by-inspection and replace with quality-by-design-and-improvement.  

Metric Abuse is a Crime. DRATs are a dangerous addiction. DRATs kill Motivation. DRATs Kill Organisations.

Charts created using BaseLine

Anyone for more Boiled Frog?

There is a famous metaphor for the dangers of denial and complacency called the boiled frog syndrome.

Apparently if you drop a frog into hot water it will notice and jump out  but if you put a frog in water at a comfortable temperature and then slowly heat it up it will not jump out – it does not notice the slowly rising temperature until it is too late – and it boils.

The metaphor is used to highlight the dangers of not being aware enough of our surroundings to notice when things are getting “hot” – which means we do not act in time to prevent a catastrophe.

There is another side to the boiled frog syndrome – and this when improvements are made incrementally by someone else and we do not notice those either. This is the same error of complacency and there is no positive feedback so the improvement investment fizzles out – without us noticing that either.  This is a disadvantage of incremental improvement – we only notice the effect if we deliberately measure at intervals and compare present with past. Not many of us appear to have the foresight or fortitude to do that. We are the engineers of our own mediocrity.

There is an alternative though – it is called improvement-by-design. The difference from improvement-by-increments is that with design you deliberately plan to make a big beneficial change happen quickly – and you can do this by testing the design before implementing it so that you know it is feasible.  When the change is made the big beneficial difference is noticed – WOW! – and everyone notices: supporters and cynics alike.  Their responses are different though – the advocates are jubilant and the cynics are shocked. The cynics worldview is suddenly challenged – and the feeling is one of positive confusion. They say “Wow! That’s a miracle – how did you do that?”.

So when we understand enough to design a change then we should use improvement-by-design; and when we don’t understand enough we have no choice but to do use improvement-by-discovery.

Systemic Sickness

Sickness, illness, ill health, unhealthy, disease, disorder, distress are all words that we use when how we feel falls short of how we expect to feel. The words impliy an illness continuum and each of us appeara to use different thresholds as action alerts.

 The first is crossed when we become aware that all is not right and our response and to enter a self-diagnosis and self-treatment mindset. This threshold is context-dependent; we use external references to detect when we have strayed too far from the norm – we compare ourselves with others. This early warning system works most of the time – after all chemists make their main business from over the counter (OTC) remedies!

If the first stage does not work we cross the second threshold when we accept that we need expert assistance and we switch into a different mode of thinking – the “sick role”.  Crossing the second threshold is a big psychological step that implies a perceived loss of control and power – and explains why many people put off seeking help. They enter a phase of denial, self-deception and self-justification which can be very resistant to change.

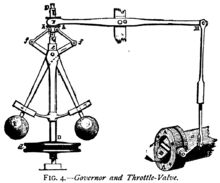
The same is true of organisations – when they become aware that they are performing below expectation then a “self-diagnosis” and “self-treatment” is instigated, except that it is called something different such as an “investigation” or “root cause analysis” and is followed by a “recommendations” and an “action plan”.  The requirements for this to happen are an ability to become aware of a problem and a capability to understand and address the root cause both effectively and efficiently.  This is called dynamic stability or “homeostasis” and is a feature of many systems.  The image of a centrifugal governor is a good example – it was one of the critical innovations that allowed the power of steam to be harnessed safely a was a foundation stone of the industrial revolution. The design is called a negative feedback stabiliser and it has a drawback – there may be little or no external sign of the effort required to maintain the stability.

Problems arise when parts of this expectation-awareness-feedback-adjustment process are missing, do not work, or become disconnected. If there is an unclear expectation then it is impossible to know when and how to react. Not being clear what “healthy” means leads to confusion. It is too easy to create a distorted sense of normality by choosing a context where everyone is the same as you – “birds of a feather flock together”.

Another danger is to over-simplify the measure of health and to focus on one objective dimension – money – with the assumption that if the money is OK then the system must be OK.  This is an error of logic because although a healthy system implies healthy finances, the reverse is not the case – a business can be both making money and heading for disaster.

Failure can also happen if the most useful health metrics are not measured, are measured badly, or are not communicated in a meaningful way.  Very often metrics are not interpreted in context, not tracked over time, and not compared with the agreed expectation of health.  These multiple errors of omission lead to conterproductive behaviour such as the use of delusional ratios and arbitrary targets (DRATs), short-termism and “chasing the numbers” – all of which can further erode the underlying health of the system – like termites silently eating the foundations of your house. By the time you notice it is too late – the foundations have crumbled into dust!

To achieve and maintain systemic health it is necessary to include the homeostatic mechanisms at the design stage. Trying to add or impose the feedback functions afterwards is less effective and less efficient.  A healthy system is desoigned with sensitive feedback loops that indicate the effort required to maintain dynamic stablity – and if that effort is increasing then that alone is cause for further investigation – often long before the output goes out of specification.  Healthy systems are economic and are designed to require a minimum of effort to maintain stability and sustain performance – good design feels effortless compared with poor design. A system that only detects and reacts to deviations in outputs is an inferior design – it is like driving by looking in the rear-view mirror!

Healthy systems were designed to be healthy from the start or have evolved from unhealthy ones – the books by Jim Collins describes this: “Built to Last” describes organisations that have endured because they were destined to be great from the start. “Good to Great”  describes organisations that have evolved from unremarkable performers into great performers. There is a common theme to great companies irrespective of their genesis – data, information, knowledge, understanding and most important of all a wise leader.