Imagine you are a hospital doctor. Some patients die. But how many is too many before you or your hospital are labelled killers? If you check out the BBC page
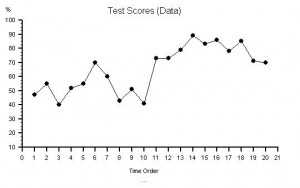
So is the map dead? Not at all – the value of a map in providing a sense of perspective, context and location is just as useful as ever. And there are many sorts of maps apart from the static, structural, geographical maps ones we are used to. The really exciting maps are the dynamic ones – the functional maps. These are maps that show how things are working and flowing, not only where they are. Imagine if your SatNav had both a static map and was able to access a real time dynamic map of traffic flow. Just think how much more useful it could be? However, to achieve that implies that each person on the road would have to contribute both their position and their intended destination to a central system – isn’t that Big Brother back. Air traffic control (ATC) systems have done this for years for a very good reason: aeroplanes full of passengers are perishable goods – they can’t land anywhere they like and they can’t stay up there waiting to land for ever. You can’t afford to have traffic jams with aeroplanes – so every pilot has to file a flight plan and will only be given ATC clearance to take off if their destination is capable of offering them a landing slot in an acceptable time frame – i.e. before the plane runs out of fuel! Static maps will always be needed to provide us with a sense of perspective – and in the future dynamic maps will revolutionise the way that we do everything – but only if we are prepared to behave collectively and share our data. We want to see the wood, the trees and even the breeze through the leaves! Carl Jung described a theory of psychological types that was later developed into the Myers-Briggs Type Indictator (MBTI). This extensively validated method classifies people into sixteen broad groups based on four dimensions that are indicated by a letter code. It is important to appreciate that there are no good/bad types or right/wrong types – each describes a mode of thinking: a model of how we gather information, make decisions and act on those decisions. Everyone uses all the modes of thinking to some degree – we just prefer some more than others and so we get more practice with them. The purpose of MBTI is not to “correct” someone elses psychologcial type – it is to gain a conscious and shared awareness of the effect of psychological types on interpersonal and team dynamics. For example, some tasks and challenges suit some psychological types better than others – they resonate – and when this happens these tasks are achieved more easily and with greater satisfaction. “One’s meat is another’s poison” sums the idea up. Just having insight into this dynamic is helpful because it offers new options to avoid frustrating, futile and wasteful conflict. So if you are curious find out your MBTI – you can do it on line in a few minutes (for example http://www.personalitytest.net/types/index.htm) and with that knowledge you can learn what your psychological type implies. Mine is INFJ … The model of learning that I have sketched is called the Conscious-Competence model or – as I prefer to call it – Capability Awareness. We all start bottom left – not aware of our lack of capablity – let’s call that Blissful Ignorance. Then something happens that challenges our complacency – we become aware of our lack of capability – ouch! That is Painful Awareness. From there we have three choices – retreat (denial), stay where we are (distress) or move forward (discovery). If we choose the path of discovery we must actively invest time and effort to develop our capability to get to the top right position – where we are aware of what we can do – the state of Know How. Then as we practice or new capability and build our experience we gradually become less aware of out new capability – it becomes Second Nature. We can now do it without thinking – it becomes sort of hard-wired. Of course, this is a very useful place to get to: it does conceal a danger though – we start to take our capability for granted as we focus our attention on new challenges. We become complacent – and as the world around us is constantly changing we may be unaware our once-appropriate capability may be growing less useful. Being a wizard with a set of log-tables and a slide-rule became an unnecessary skill when digital calculators appeared – that was fairly obvious. The silent danger is that we slowly slide from Second-Nature to Blissful-Ignorance; usually as we get older, become more senior, acquire more influence, more money and more power. We now have the dramatic context for a nasty shock when, as a once capable and respected leader, we suddenly and painfully become aware of our irrelevance. Many leaders do not survive the shock and many organisations do not survive it either – especially if a once-powerful leader switches to self-justifying denial and the blame-others behaviour. To protect ourselves from this unhappy fate just requires that we understand the dynamic of this deceptively simple model; it requires actively fostering a curious mindset; it requires a willingness to continuously challenge ourselves; to openly learn from a wide network of others who have more capability in the area we want to develop; and to be open to sharing with others what we have learned. Maybe 360 feedback is not such a scary idea? I learned a new trick this week and I am very pleased with myself for two reasons. Firstly because I had the fortune to have been recommended this trick; and secondly because I had the foresight to persevere when the first attempt didn’t work very well. The trick I learned was using a webinar to provide interactive training. “Oh that’s old hat!” I hear some of you saying. Yes, teleconferencing and webinars have been around for a while – and when I tried it a few years ago I was disappointed and that early experience probably raised my unconscious resistance. The world has moved on – and I hadn’t. High-speed wireless broadband is now widely available and the webinar software is much improved. It was a breeze to set up (though getting one’s microphone and speakers to work seems a perennial problem!). The training I was offering was for the BaseLine process behaviour chart software – and by being able to share the dynamic image of the application on my computer with all the invitees I was able to talk through what I was doing, how I was doing it and the reasons why I was doing it. The immediate feedback from the invitees allowed me to pace the demonstration, repeat aspects that were unclear, answer novel queries and to demonstrate features that I had not intended to in my script. The tried and tested see-do-teach method has been reborn in the Information Age and this old dog is definitely wagging his tail and looking forward to his walk in the park (and maybe a tasty treat, huh?) Just two, innocent-looking, three-letter words. So what is the big deal? If you’ve been a parent of young children you’ll recognise the feeling of desperation that happens when your pre-schooler keeps asking the “But why?” question. You start off patiently attempting to explain in language that you hope they will understand, and the better you do that the more likely you are to get the next “But why?” response. Eventually you reach the point where you’re down to two options: “I don’t know!” or “Just because!”. How are you feeling now about yourself and your young interrogator? The troublemaker word is “but”. A common use of the word “but” in normal conversation is “Yes … but …” such as in “I hear what you are saying but …”. What happens inside your head when you hear that? Does it niggle? Does the red mist start to rise? Used in this way the word “but” reveals a mental process called discounting – and the message that you registered unconsciously is closer to “I don’t care about you and your opinion, I only care about me and my opinion and here it comes so listen up!”. This is a form of disrespectful behaviour that often stimulates a defensive response – even an argument – which only serves to further polarise the separate opinions, to deepen the mutual disrespect, and to erode trust. It is a self-reinforcing negative-outcome counter-productive behaviour. The trickster word is “why?” When someone asks you this open-ended question they are often just using it as a shortcut for a longer series of closed, factual questions such as “how, what, where, when, who …”. We are tricked because we often unconsciously translate “why?” into “what are your motives for …” which is an emotive question and can unconsciously trigger a negative emotional response. We then associate the negative feeling with the person and that hardens prejudices, erodes trust, reinforces resistance and fuels conflict. My intention in this post is only to raise conscious awareness of this niggle. If you are curious to test this youself – try consciously tuning in to the “but” and “why” words in conversation and in emails. See if you can consciously register your initial emotional response – the one that happens in the split second before your conscious thoughts catch up. Then ask youself the question “Did I just have a positive or a negative feeling? … change implies learning; … learning implies asking questions; … and asking questions implies listening with both humility and confidence. The humility of knowing that their are many things we do not yet understand; and the confidence of knowing that there are many ways we can grow our understanding. Change is a force – and when we apply a force to a system we meet resistance. The natural response to feeling resistance is to push harder; and when we do that the force of resistance increases. With each escalation the amount of effort required for both sides to maintain the stalemate increases and the outcome of the trial is decided by the strength and stamina of the protagonists. One may break, tire or give up …. eventually. The counter-intuitive reaction to meeting resistance is to push less and to learn more; and it is more effective strategy. We can observe this principle in the behaviour of a system that is required to deliver a specific performance – such as a delivery time. The required performance is often labelled a “target” and is usually enforced with a carrot-flavoured-stick wrapped in a legal contract. The characteristic sign on the performance chart of pushing against an immovable target is the Horned Gaussian – the natural behaviour of the system painfully distorted by the target. Our natural reaction is to push harder; and initially we may be rewarded with some progress. And with a Herculean effort we may actually achieve the target – though at what cost? Our front-line fighters are engaged in a never-ending trial of strength, holding back the Horn that towers over them and that threatens to tip over the target at any moment. The effort, time, and money expended is out of all proportion to the improvement gained and just maintaining the status quo is exhausting. Our unconscious belief is that if we weather the storm and push hard enough we will “break” the resistance, and after that it will be plain sailing. This strategy might work in the affairs of Man – it doesn’t work with Nature. We won’t break the Laws of Nature by pushing harder. They will break us. So, consider what might happen if we did the opposite? When we feel resistance we pull back a bit; we ask questions; we seek to see from the opposite perspective and to broaden our own perspective; we seek to expand our knowledge and to deepen our understanding. When we redirect our effort, time and money into understanding the source of the resistance we uncover novel options; we get those golden “eureka!” moments that lead to synergism rather than to antagonism; to win-win rather than lose-lose outcomes. Those options were there all along – they were just not visible with our push mindset. Change is a force – so “May the 4th be with you“. I often hear the comments “I cannot see the wood for the trees”, “I am drowning in an ocean of data” and “I cannot identify the cause of the problem”. We have data, we know there is a problem and we sense there is a soluton; the gap seems to be using the data to find a solution to the problem. Most quantitative data is presented as tables of columns and rows of numbers; and is indigestable by the majority of people. Numbers are a recent invention on a biological timescale and we have not yet evolved to effortlessly process data presented in that format. We are visual animals and we have evolved to be very good at seeing patterns in pictures – because it was critical to survival. Another recent invention is spoken language and, long before writing was invented, accumulated knowledge and wisdom was passed down by word of mouth as legends, myths and stories. Stories are general descriptions that suggest specific solutions. So why do we have such difficulty in extracting the story from the data? Perhaps it is because we use our ears to hear stories that are communicated in words and we use our eyes to see patterns in pictures. Presenting quantitative data as streams of printed symbols just doesn’t work as well. To see the story in the data we need to present it as a picture and then talk about what we perceive. Here are some data – a series of numbers recorded over a period of time – what is the story? 47, 55, 40, 52, 55, 70, 60, 43, 51, 41, 73, 73, 79, 89, 83, 86, 78, 85, 71, 70 Here is the same data converted into a picture. You can see the message in the data … something changed between measurement 10 and 11. The chart does not tell us why it changed – it only tells us when it happened and sugegsts what to look for – anything that is capable of causing the effect we can see. We now have a story and our curiosity is aroused. We want an explanation; we want to understand; we want to learn; and we want to improve. (For source of data and image visit www.valuesystemdesign.com). A picture can save a thousand words and ten thousand numbers! How many know about the man who invented them and why? Henry Laurence Gantt (1861-1919) was an engineer and he invented the chart for a very different purpose – so that the workers and the managers could see at a glance the progress of the work and to see what was impairing the flow. Decades before the invention of the computer, Henry Gantt created a simple and incredibly powerful visual tool for enabling workers and managers to improve processes together. I know how simple and powerful the original Gantt chart is because I use it all the time for capturing the behaviour of a process in a visual form that stimulates constructive conversations which result in win-win-win improvements. All you need is some squared paper, a pencil, a clock, a Mark I Eyeball or two, and a bit of practice. You can feel it almost immediately – there is something in the room that no one is talking about. An invisible elephant in the room, a rotting something under the table. This week I have been pondering the cause of this dis-ease and my eureka moment happened while re-reading a book called “The Speed of Trust” by Stephen R. Covey. A common elephant-in-the-room appears to be distrust and this got me thinking about both the causes of distrust and the effects of distrust. My doodle captures the output of my musing. For me, a potent cause of distrust is to be discounted; and discounting comes from disrespect. This can happen both within yourself and between yourself and others. If you feel un-trust-worthy then you tend to disengage; and by disengaging the system functions less well – it becomes dysfunctional. Dysfunction erodes respect and so on around the vicious circle. This then led me to the question: Why haven’t we all drowned in our own distrust by now? I believe what happens is that we reach an equilibrium where our level of trust is stable; so there must be a counteracting trust-building force that balances the trust-eroding force. That trust-building force seem to comes from our day-to-day social interactions with others. The Achilles Heel of negative-cause-effect circles is that you can break into them at many points to sap their power and reduce their influence. So, one strategy might be to identify the Errors of Commission that create the Disease of Distrust. Consider the question: “If I have developed a high level of trust then what could I do to erode it as quickly as possible?”. Disrespectful attitude and discounting behaviour would be all that is needed to start the vicious downward spiral of distrust disease. Who of us never disrespects or discounts others? Are we all infected with the same disease? Is there a cure or can we only expect to hold it in remission? How can we strengthen our emotional immune systems and neutralise the infective agents of the Disease of Distrust? Do we just need to identify and stop our trust eroding behaviour? That would be a start. We all know the phrase “you get what you pay for” and we all know from experience that higher quality goods and services cost more. So, it follows that if we improve the quality of our product or service then we are always going to have to charge our customers more for it. But is that always the case? If we add extra value to the product then it is likely that it will cost us more to do that and we may have to pass that cost on; but improvement often comes from removing something that was preventing a higher quality output. When we remove something our costs are likely to go down and this reduction in cost can be passed on to the customer. Unfortunately the idea that lower costs mean lower quality is also deeply engrained into our thinking – so if a supplier offers what appears to be higher quality at a lower price we get suspicious. There must be a catch or a trick. So, to avoid disappointing your customers when you make an improvement by removing an impediment to quality – just increase the price a bit. That way your costs go down, the price goes up, the customers expectation is met and everyone is happy; your customers and especially your accountant! It can’t be that easy surely. There must be catch?Can We See the Wood for the Trees?
 “The Map is not the Territory” but it is a very useful because it provides a sense of perspective; the bigger picture; where you are; and what you would need to do to get from A to B. A map can also provide the the fine detail, they way-points on your journey, and what to expect to see along the way. I remember the first computer programs that would find a route from A to B for me and present it as a printed recipe for the journey; how far it was and, best of all, how long it would take – so I knew when to set off to be reasonably confident I could arrive on time. Of course, there might always be unexpected holdups along the way but it was a big step forward. One problem was using the recipe as I drove, and another was when I accidently took a wrong turn, which is easy in unfamiliar surroundings with only a list of instructions to go by. If I came off the intended track I would get lost – so I still needed the paper map as a backup. The trouble now was I did not alwasy know where I was on the map – because I was lost. Two steps forward and one step backwards. Now we have Google Maps and we can see what we will actually see on the way – before we even leave home! And with SatNav we can get this map-reading-and-route-planning done for us in real time so if we choose to, are forced to, or accidentially take a wrong turn it can get us back-on-track. The days of heated debate between the map reader and the map needer have gone and it seems the only need we have for a map now is as a backup if the SatNav breaks down. (This did happen to me once, I didn’t have a map in the car and the only information I had was the postcode of my destination. I was pressed for time so I drove around randomly until I passed a shop that sold SatNavs and bought a new/spare one – entered the postcode and arrived at my intended destination just in time!).
Is this just a Clash of Personality?
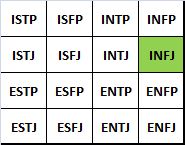 Have you ever have the experience of trying to work on a common challenge with a team member and it just feels like you are on different planets? You are using the same language yet are not communicating – they go off at apparently random tangents while you are trying to get a decision; they deluge you with detail when you ask about the big picture; you get upset when their cold logic threatens to damage team unity. The list is endless. If you experience this sort of confusion and frustration then you may be experiencing a personality clash – or to be more accurate a pyschological type mismatch.
Is this Second Nature or Blissful Ignorance?
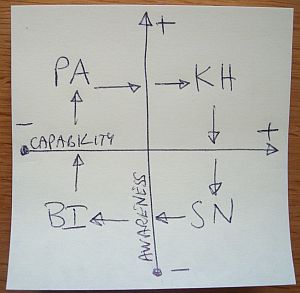 I haven’t done a Post-It doodle for a while so here is one of my favourites that I was reminded of this week. Recently my organisation has mandated that we complete a 360-feedback exercise – which for me generated some anxiety – even fear. Why? What am I scared of? Could it be that I am unconsciously aware that there are things I am not very good – I just don’t know what they are – and by asking for feedback I will become painfully aware of my limitations? What then? Will I able to address those weaknesses or do I have to live with them? And even more painful to consider; what if I believed I was good at something because I have been doing it so long it has become second nature – and I discover that what I was good at is not longer appropriate or needed? Wow! That is not going to feel much fun. I think I’ll avoid the whole process by keeping too busy to complete the online questionnaire. That strategy did not work of course – a head-in-the-sand approach often doesn’t. So I completed it and await my fate with trepidation.
Can an Old Dog learn New Tricks?
But Why?
To Push or Not to Push? Is that the Question?
Can We See a Story in the Data?
Are your Targets a Pain in the #*&!?
 If your delivery time targets are giving you a pain in the #*&! then you may be sitting on a Horned Gaussian and do not realise it. What is a Horned Gaussian? How do you detect one? And what causes it? To establish the diagnosis you need to gather the data from the most recent couple of hundred jobs and from it calculate the interval from receipt to delivery. Next create a tally chart with Delivery Time on the vertical axis and Counts on the horizontal axis; mark your Delivery Time Target as a horizontal line about two thirds of the way up the vertical axis; draw ten equally spaced lines between it and the X axis and five more above the Target. Finally, sort your delivery times into these “bins” and look at the profile of the histogram that results. If there is a clearly separate “hump” and “horn” and the horn is just under the target then you have confirmed the diagnosis of a Horned Gaussian. The cause is the Delivery Time Target, or more specifically its effect on your behaviour. If the Target is externally imposed and enforced using either a reward or a punishment then when the delivery time for a request approaches the Target, you will increase the priority of the request and the job leapfrogs to the front of the queue, pushing all the other jobs back. The order of the jobs is changing and in a severe case the large number of changing priorities generates a lot of extra work to check and reschedule the jobs. This extra work exacerbates the delays and makes the problem worse, the horn gets taller and sharper, and the pain gets worse. Does that sound a familiar story? So what is the treatment? Well, to decide that you need to create a graph of delivery times in time order and look at the pattern (using charting tool such as BaseLine© www.valuesystemdesign.com makes this easier and quicker). What you do depends on what the chart says to you … it is the Voice of the Process. Improvement Science is learning to understand the voice of the process.
Anyone Heard of Henry Gantt?
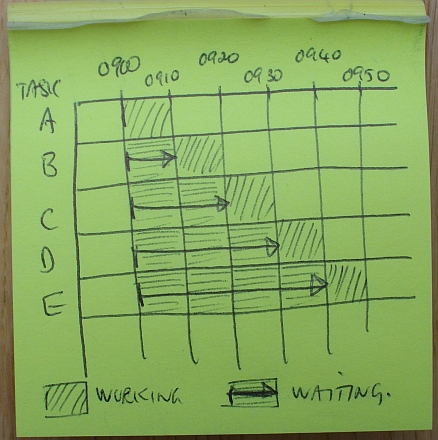 Most managers have heard of Gantt charts and associate them with project management where they are widely used to help coordinate the separate threads of work so that the project finishes on time.
What is the Dis-Ease?
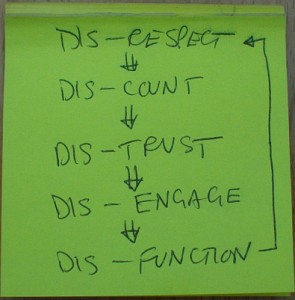 Do you ever go into places where there is a feeling of uneasiness?
What Blocks Improvement?
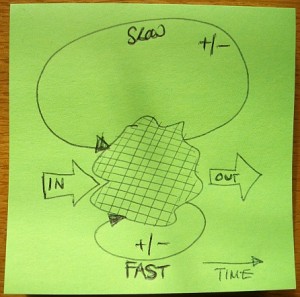 My focus this week has been to ask the question “What blocks improvement?”. The answers that I found most interesting were “I didn’t realise there was a problem.” and “I feel there is a problem but I don’t know where to focus my attention.” This set me pondering and eventually I had a bit of an “eureka” moment. It isn’t something that is present that creates this blindness – it is something that is missing. And the only way you can see what isn’t there is by comparison with when it is there – just like the game of “Spot the Difference”. When I compared what I saw with what I know is possible the thing I didn’t see was a fast-feedback loop. Hence the doodle. It appears that there are at least four dimensions to feedback – sign, magnitude, accuracy and timing. The speed of the feedback needs to be appropriate to the speed of the improvement; so if we want rapid improvement we need a fast-and-accurate feedback loop – a learning loop. A slow or inaccurate learning loop not only doesn’t work – it can actually make the problem worse. So, my take-home this week is to actively search for the learning loops and if I don’t see one then I have something to focus on improving.
Improvement costs more doesn’t it?
Category: Techniques
The application of the tools and theory of Improvement Science in practice.


