Good Science, an antidote to Ben Goldacre’s “Bad Science”

by Julian Simcox & Terry Weight

Ben Goldacre has spent several years popularizing the idea that we all ought all to be more interested in science.

Every day he writes and tweets examples of “bad science”, and about getting politicians and civil servants to be more evidence-based; about how governmental interventions should be more thoroughly tested before being rolled-out to the hapless citizen; about how the development and testing of new drugs should be more transparent to ensure the public get drugs that actually make a difference rather than risk harm; and about bad statistics – the kind that “make clever people do stupid things”(8).

Like Ben we would like to point the public sector, in particular the healthcare sector and its professionals, toward practical ways of doing more of the good kind of science, but just what is GOOD science?

In collaboration with the Cabinet Office’s behaviour insights team, Ben has recently published a polemic (9) advocating evidence-based government policy. For us this too is commendable, yet there is a potentially grave error of omission in their paper which seems to fixate upon just a single method of research, and risks setting-up the unsuspecting healthcare professional for failure and disappointment – as Abraham Maslow once famously said

.. it is tempting, if the only tool you have is a hammer, to treat everything as if it were a nail”(17)

We question the need for the new Test, Learn and Adapt (TLA) model he offers because the NHS already possesses such a model – one which in our experience is more complete and often simpler to follow – it is called the “Improvement Model”(15) – and via its P-D-S-A mnemonic (Plan-Do-Study-Act) embodies the scientific method.

Moreover there is a preexisting wealth of experience on how best to embed this thinking within organisations – from top-to-bottom and importantly from bottom-to-top; experience that has been accumulating for fully nine decades – and though originally established in industrial settings has long since spread to services.

We are this week publishing two papers, one longer and one shorter, in which we start by defining science, ruing the dismal way in which it is perennially conveyed to children and students, the majority of whom leave formal education without understanding the power of discovery or gaining any first hand experience of the scientific method.

View Shorter Version Abstract

We argue that if science were to be defined around discovery, and learning cycles, and built upon observation, measurement and the accumulation of evidence – then good science could vitally be viewed as a process rather than merely as an externalized entity. These things comprise the very essence of what Don Berwick refers to as Improvement Science (2) as embodied by the Institute of Healthcare Improvement (IHI) and in the NHS’s Model for Improvement.

We also aim to bring an evolutionary perspective to the whole idea of science, arguing that its time has been coming for five centuries, yet is only now more fully arriving. We suggest that in a world where many at school have been turned-off science, the propensity to be scientific in our daily lives – and at work – makes a vast difference to the way people think about outcomes and their achievement. This is especially so if those who take a perverse pride in saying they avoided science at school, or who freely admit they do not do numbers, can get switched on to it.

The NHS Model for Improvement has a pedigree originating with Walter Shewhart in the 1920’s, then being famously applied by Deming and Juran after WWII. Deming in particular encapsulates the scientific method in his P-D-C-A model (three decades later he revised it to P-D-S-A in order to emphasize that the Check stage must not be short-changed) – his pragmatic way of enabling a learning/improvement to evolve bottom-up in organisations.

After the 1980’s Dr Don Berwick , standing on these shoulders, then applied the same thinking to the world of healthcare – initially in his native America. Berwick’s approach is to encourage people to ask questions such as: What works? .. and How would we know? His method, is founded upon a culture of evidence-based learning, providing a local context for systemic improvement efforts. A new organisational culture, one rooted in the science of improvement, if properly nurtured, may then emerge.

Yet, such a culture may initially jar with the everyday life of a conventional organisation, and the individuals within it. One of several reasons, according to Yuval Harari (21), is that for hundreds of generations our species has evolved such that imagined reality has been lorded over objective reality. Only relatively recently in our evolution has the advance of science been leveling up this imbalance, and in our papers we argue that a method is now needed that enables these two realities to more easily coexist.

We suggest that a method that enables data-rich evidence-based storytelling – by those who most know about the context and intend growing their collective knowledge – will provide the basis for an approach whereby the two realities may do just that.

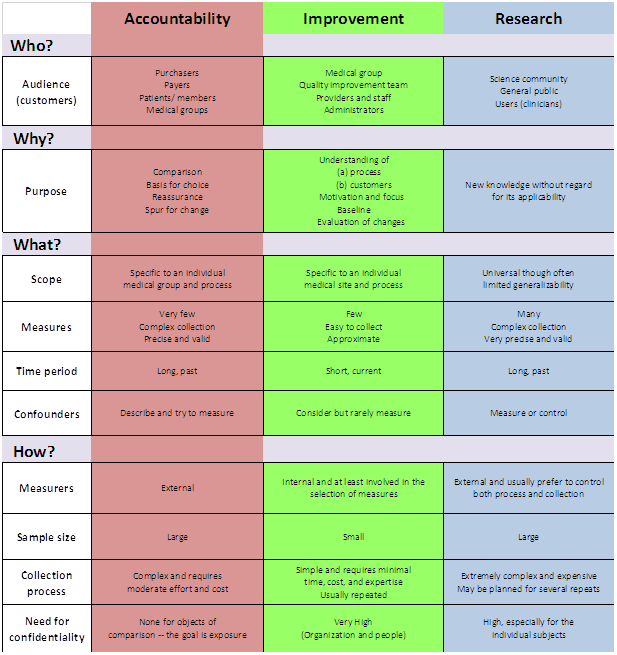
In people’s working lives, a vital enabler is the 3-paradigm “Accountability/Improvement/Research” measurement model (AIRmm), reflecting the three archetypal ways in which people observe and measure things. It was created by healthcare professionals (23) to help their colleagues and policy-makers to unravel a commonly prevailing confusion, and to help people make better sense of the different approaches they may adopt when needing to evidence what they’re doing – depending on the specific purpose. An amended version of this model is already widely quoted inside the NHS, though this is not to imply that it is yet as widely understood or applied as it needs to be.

goodscience_AIR_model

This 3-paradigm A-I-R measurement model underpins the way that science can be applied by, and has practical appeal for, the stretched healthcare professional, managerial leader, civil servant.

Indeed for anyone who intuitively suspects there has to be a better way to combine goals that currently feel disconnected or even in conflict: empowerment and accountability; safety and productivity; assurance and improvement; compliance and change; extrinsic and intrinsic motivation; evidence and action; facts and ideas; logic and values; etc.

Indeed for anyone who is searching for ways to unify their actions with the system-based implementation of those actions as systemic interventions. Though widely quoted in other guises, we are returning to the original model (23) because we feel it better connects to the primary aim of supporting healthcare professionals make best sense of their measurement options.

In particular the model makes it immediately plain that a way out of the apparent Research/Accountability dichotomy is readily available to anyone willing to “Learn, master and apply the modern methods of quality control, quality improvement and quality planning” – the recommendation made for all staff in the Berwick Report (3).

In many organisations, and not just in healthcare, the column 1 paradigm is the only game in town. Column 3 may feel attractive as a way-out, but it also feels inaccessible unless there is a graduate in statistician on hand. Moreover, the mainstay of the Column 3 worldview: the Randomized Controlled Trial (RCT) can feel altogether overblown and lacking in immediacy. It can feel like reaching for a spanner and finding a lump hammer in your hand – as Berwick says “Fans of traditional research methods view RCTs as the gold standard, but RCTs do not work well in many healthcare contexts” (2).

Like us, Ben is frustrated by the ways that healthcare organisations conduct themselves – not just the drug companies that commercialize science and publish only the studies likely to enhance sales, but governments too who commonly implement politically expedient policies only to then have to subsequently invent evidence to support them.

Policy-based evidence rather than evidence-based policy.

Ben’s recommended Column 3-style T-L-A approach is often more likely to make day-to-day sense to people and teams on the ground if complemented by Column 2-style improvement science.
One reason why Improvement Science can sometimes fail to dent established cultures is that it gets corralled by organisational “experts” – some of whom then use what little knowledge they have gathered merely to make themselves indispensable, not realising the extent to which everyone else as a consequence gets dis-empowered.

In our papers we take the opportunity to outline the philosophical underpinnings, and to do this we have borrowed the 7-point framework from a recent paper by Perla et al (35) who suggest that Improvement Science:

1. Is grounded in testing and learning cycles – the aim is collective knowledge and understanding about cause & effect over time. Some scientific method is needed, together with a way to make the necessary inquiry a collaborative one. Shewhart realised this and so invented the concept “continual improvement”.

2. Embraces a combination of psychology and logic – systemic learning requires that we balance myth and received wisdom with logic and the conclusions we derive from rational inquiry. This balance is approximated by the Sensing-Intuiting continuum in the Jungian-based MBTI model (12) reminding us that constructing a valid story requires bandwidth.

3. Has a philosophical foundation of conceptualistic pragmatism (16) – it cannot be expected that two scientists when observing, experiencing, or experimenting will make the same theory-neutral observations about the same event – even if there is prior agreement about methods of inference and interpretation. The normative nature of reality therefore has to be accommodated. Whereas positivism ultimately reduces the relation between meaning and experience to a matter of logical form, pragmatism allows us to ground meaning in conceived experience.

4. Employs Shewhart’s “theory of cause systems” – Walter Shewhart created the Control Chart for tuning-in to systemic behaviour that would otherwise remain unnoticed. It is a diagnostic tool, but by flagging potential trouble also aids real time prognosis. It might have been called a “self-control chart” for he was especially interested in supporting people working in and on their system being more considered (less reactive) when taking action to enhance it without over-reacting – avoiding what Deming later referred to as “Tampering” (4).

5. Requires the use of Operational Definitions – Deming warned that some of the most important aspects of a system cannot be expressed numerically, and those that can require care because “there is no true value of anything measured or observed” (5). When it comes to metric selection therefore it is essential to understand the measurement process itself, as well as the “operational definition” that each metric depends upon – the aim being to reduce ambiguity to zero.

6. Considers the contexts of both justification and discovery – Science can be defined as a process of discovery – testing and learning cycles built upon observation, measurement and accumulating evidence or experience – shared for example via a Flow Chart or a Gantt chart in order to justify a belief in the truth of an assertion. To be worthy of the term “science” therefore, a method or procedure is needed that is characterised by collaborative inquiry.

7. Is informed by Systems Theory – Systems Theory is the study of systems, any system: as small as a quark or as large as the universe. It aims to uncover archetypal behaviours and the principles by which systems hang together – behaviours that can be applied across all disciplines and all fields of research. There are several types of systems thinking, but Jay Forrester’s “System Dynamics” has most pertinence to Improvement Science because of its focus on flows and relationships – recognising that the behaviour of the whole may not be explained by the behaviour of the parts.

In the papers, we say more about this philosophical framing, and we also refer to the four elements in Deming’s “System of Profound Knowledge”(5). We especially want to underscore that the overall aim of any scientific method we employ is contextualised knowledge – which is all the more powerful if continually generated in context-specific experimental cycles. Deming showed that good science requires a theory of knowledge based upon ever-better questions and hypotheses. We two aim now to develop methods for building knowledge-full narratives that can work well in healthcare settings.

We wholeheartedly agree with Ben that for the public sector – not just in healthcare – policy-making needs to become more evidence-based.

In a poignant blog from the Health Foundation’s (HF) Richard Taunt (24), he recently describes attending two recent conferences on the same day. At the first one, policymakers from 25 countries had assembled to discuss how national policy can best enhance the quality of health care. When collectively asked which policies they would retain and repeat, their list included: use of data, building quality improvement capability, ensuring senior management are aware of improvement approaches, and supporting and spreading innovations.

In a different part of London, UK health politicians happened also to be debating Health and Care in order to establish the policy areas they would focus on if forming the next government. This second discussion brought out a completely different set of areas: the role of competition, workforce numbers, funding, and devolution of commissioning. These two discussions were supposedly about the same topic, but a Venn diagram would have contained next to no overlap.

Clare Allcock, also from the HF, then blogged to comment that “in England, we may think we are fairly advanced in terms of policy levers, but (unlike, for example in Scotland or the USA) we don’t even have a strategy for implementing health system quality.” She points in particular to Denmark who recently have announced they are phasing out their hospital accreditation scheme in favour of an approach strongly focused around quality improvement methodology and person-centred care. The Danes are in effect taking the 3-paradigm model and creating space for Column 2: improvement thinking.

The UK needs to take a leaf out of their book, for without changing fundamentally the way the NHS (and the public sector as a whole) thinks about accountability, any attempt to make column 2 the dominant paradigm is destined to be still born.

It is worth noting that in large part the AIRmm Column 2 paradigm was actually central to the 2012 White Paper’s values, and with it the subsequent Outcomes Framework consultation – both of which repeatedly used the phrase “bottom-up” to refer to how the new system of accountability would need to work, but somehow this seems to have become lost in legislative procedures that history will come to regard as having been overly ambitious. The need for a new paradigm of accountability however remains – and without it health workers and clinicians – and the managers who support them – will continue to view metrics more as something intrusive than as something that can support them in delivering enhancements in sustained outcomes. In our view the Stevens’ Five Year Forward View makes this new kind of accountability an imperative.

“Society, in general, and leaders and opinion formers, in particular, (including national and local media, national and local politicians of all parties, and commentators) have a crucial role to play in shaping a positive culture that, building on these strengths, can realise the full potential of the NHS.
When people find themselves working in a culture that avoids a predisposition to blame, eschews naïeve or mechanistic targets, and appreciates the pressures that can accumulate under resource constraints, they can avoid the fear, opacity, and denial that will almost inevitably lead to harm.”
Berwick Report (3)

Changing cultures means changing our habits – it starts with us. It won’t be easy because people default to the familiar, to more of the same. Hospitals are easier to build than relationships; operations are easier to measure than knowledge, skills and confidence; and prescribing is easier than enabling. The two of us do not of course possess a monopoly on all possible solutions, but our experience tells us that now is the time for: evidence-rich storytelling by front line teams; by pharmaceutical development teams; by patients and carers conversing jointly with their physicians.

We know that measurement is not a magic bullet, but what frightens us is that the majority of people seem content to avoid it altogether. As Oliver Moody recently noted in The Times ..

Call it innumeracy, magical thinking or intrinsic mental laziness, but even intelligent members of the public struggle, through no fault of their own, to deal with statistics and probability. This is a problem. People put inordinate amounts of trust in politicians, chief executives, football managers and pundits whose judgment is often little better than that of a psychic octopus.     Short of making all schoolchildren study applied mathematics to A level, the only thing scientists can do about this is stick to their results and tell more persuasive stories about them.

Too often, Disraeli’s infamous words: “Lies, damned lies, and statistics” are used as the refuge of busy professionals looking for an excuse to avoid numbers.

If Improvement Science is to become a shared language, Berwick’s recommendation that all NHS staff “Learn, master and apply the modern methods of quality control, quality improvement and quality planning” has to be taken seriously.

As a first step we recommend enabling teams to access good data in as near to real time as possible, data that indicates the impact that one’s intervention is having – this alone can prompt a dramatic shift in the type of conversation that people working in and on their system may have. Often this can be initiated simply by converting existing KPI data into System Behaviour Chart form which, using a tool like BaseLine® takes only a few mouse clicks.

In our longer paper we offer three examples of Improvement Science in action – combining to illustrate how data may be used to evidence both sustained systemic enhancement, and to generate engagement by the people most directly connected to what in real time is systemically occurring.

1. A surgical team using existing knowledge established by column 3-type research as a platform for column 2-type analytic study – to radically reduce post-operative surgical site infection (SSI).

2. 25 GP practices are required to collect data via the Friends & Family Test (FFT) and decide to experiment with being more than merely compliant. In two practices they collectively pilot a system run by their PPG (patient participation group) to study the FFT score – patient by patient – as they arrive each day. They use IS principles to separate signal from noise in a way that prompts the most useful response to the feedback in near to real time. Separately they summarise all the comments as a whole and feed their analysis into the bi-monthly PPG meeting. The aim is to address both “special cause” feedback and “common cause” feedback in a way that, in what most feel is an over-loaded system, can prompt sensibly prioritised improvement activity.

3. A patient is diagnosed with NAFLD and receives advice from their doctor to get more exercise e.g. by walking more. The patient uses the principles of IS to monitor what happens – using the data not just to show how they are complying with their doctor’s advice, but to understand what drives their personal mind/body system. The patient hopes that this knowledge can lead them to better decision-making and sustained motivation.

The landscape of NHS improvement and innovation support is fragmented, cluttered, and currently pretty confusing. Since May 2013 Academic Health Science Networks (AHSNs) funded by NHS England (NHSE) have been created with the aim of bringing together health services, and academic and industry members. Their stated purpose is to improve patient outcomes and generate economic benefits for the UK by promoting and encouraging the adoption of innovation in healthcare. They have a 5 year remit and have spent the first 2 years establishing their structures and recruiting, it is not yet clear if they will be able to deliver what’s really needed.

Patient Safety Collaboratives linked with AHSN areas have also been established to improve the safety of patients and ensure continual patient safety learning. The programme, coordinated by NHSE and NHSIQ will provide safety improvements across a range of healthcare settings by tackling the leading causes of avoidable harm to patients. The intention is to empower local patients and healthcare staff to work together to identify safety priorities and develop solutions – implemented and tested within local healthcare organisations, then later shared nationally.

We hope our papers will significantly influence the discussions about how improvement and innovation can assist with these initiatives. In the shorter paper to echo Deming, we even include our own 14 points for how healthcare organisations need to evolve. We will know that we have succeeded if the papers are widely read; if we enlist activists like Ben to the definition of science embodied by Improvement Science; and if we see a tidal wave of improvement science methods being applied across the NHS?

As patient volunteers, we each intend to find ways of contributing in any way that appears genuinely helpful. It is our hope that Improvement Science enables the cultural transformation we have envisioned in our papers and with our case studies. This is what we feel most equipped to help with. When in your sixties it easy to feel that time is short, but maybe people of every age should feel this way? In the words of Francis Bacon, the father of the scientific method.

goodscience_francisbaconquote

Download Long Version

References

goodscience_refs

Between a Rock and a Hard Place

custom_life_balance_13780A common challenge is the need to balance the twin constraints of safety and cost.

Very often we see that making a system safer will increase its cost; and cutting costs leads to increased risk of harm.

So when budgets are limited and allowing harm to happen is a career limiting event then we feel stuck between a Rock and a Hard Place.


One root cause of this problem is the incorrect belief that ‘utilisation of capacity’ is a measure of ‘efficiency’ and the association of high efficiency with low cost. This then leads to another invalid belief that if we drive up utilisation then we will get a lower cost solution.

Let us first disprove the invalid belief with a simple thought experiment.

Suppose I have a surgical department with 100 beds and I want to run it at 100% utilisation but I also need to be able to admit urgent surgical patients without delay.  How would I do that?

Simple … just delay the discharge of all the patients who are ready for discharge until a new admission needs a bed … then do a ‘hot swap’.

This is a tried and tested tactic that surgeons have used for decades to ensure their wards are full with their patients and to prevent ‘outliers’ spilling over from other wards. It is called bed blocking.

The effect is that the length of stay of patients is artifically expanded which means that more bed days are used to achieve the same outcome. So it is a less efficient design.

It also disproves the belief that utilisation is a measure of efficiency … in the example above utilisation went up while efficiency went down and without also causing a safety problem.


So what is the problem here?

The problem is that we are confusing two different sorts of ‘capacity’ … space-capacity and flow-capacity.

And when we do that we invent and implement plausible sounding plans that are doomed to fail as soon as they hit the reality test.

So why do we continue to confuse these different sorts of capacity?

Because (a) we do not know any better and (b) we copy others who do not know any better and (c) we collectively fail to learn from the observable fact that our plausible plans do not seem to work in practice.

Is there a way out of this blind-leading-the-blind mess?

For sure there is.

But it requires a willingness to unlearn our invalid assumptions and replace them with valid (i.e. tested) ones.  And it is the unlearning that is the most uncomfortable bit.

Lack of humility is what prevents us from unlearning … our egos get in the way … they quite literally blind us to what is plain to see.

We also fear loss of face … and so we avoid threats to our reputations … we simply ignore the evidence of our ineptitude.  The problem of ‘hubris’ that Atul Gawande eloquently pointed out in the 2014 Reith Lectures.

And by so doing we achieve the very outcome we are so desperately trying to avoid … we fail.

Which is sad really because with just a pinch of humility we can so easily succeed.

Yield

Dr_Bob_ThumbnailA recurring theme this week has been the concept of ‘quality’.

And it became quickly apparent that a clear definition of quality is often elusive.

Which seems to have led to a belief that quality is difficult to measure because it is subjective and has no precise definition.

The science of quality improvement is nearly 100 years old … and it was shown a long time ago, in 1924 in fact, that it is rather easy to measure quality – objectively and scientifically.

The objective measure of quality is called “yield”.

To measure yield we simply ask all our customers this question:

Did your experience meet your expectation?” 

If the answer is ‘Yes’ then we count this as OK; if it is ‘No’ then we count it as Not OK.

Yield is the ratio of the OKs divided by the number of customers who answered.


But this tried-and-tested way of measuring quality has a design flaw:

Where does a customer get their expectation from?

Because if a customer has an unrealistically high expectation then whatever we do will be perceived by them as Not OK.

So to consistently deliver a high quality service (i.e. high yield) we need to be able to influence both the customer experience and the customer expectation.


If we set our sights on a worthwhile and realistic expectation and we broadcast that to our customers, then we also need a way of avoiding their disappointment … that our objective quality outcome audit may reveal.

One way to defuse disappointment is to set a low enough expectation … which is, sadly, the approach adopted by naysayers,  complainers, cynics and doom-mongers. The inept.

That is not the path to either improvement or to excellence. It is the path to apathy.

A better approach is to set ourselves some internal standards of expectation and to check at each step if our work meets our own standard … and if it fails then we know we need have some more work to do.

This commonly used approach to maintaining quality is called a check-and-correct design.

So let us explore the ramifications of this check-and-correct approach to quality.


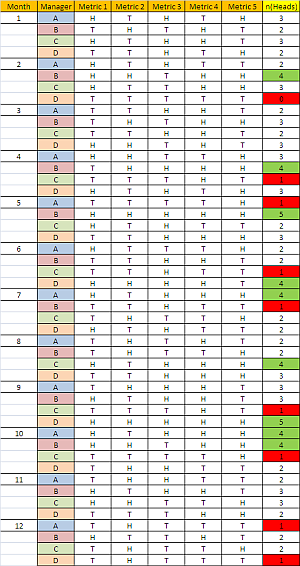
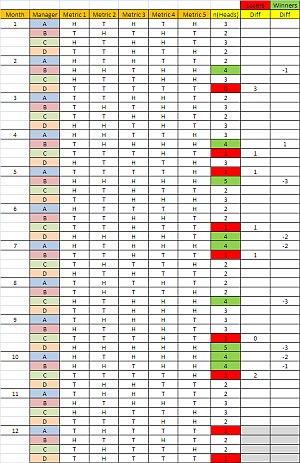
Suppose the quality of the product or service that we deliver is influenced by many apparently random factors. And when we actually measure our yield we discover that the chance of getting a right-first-time outcome is about 50%.  This amounts to little more than a quality lottery and we could simulate that ‘random’ process by tossing a coin.

So to set a realistic expectation for future customers there are two further questions we need to answer:
1. How long can an typical customer expect to wait for our product or service?
2. How much can an typical customer expect to pay for our product or service?

It is not immediately and intuitively obvious what the answers to these questions are … so we need to perform an experiment to find out.

Suppose we have five customers who require our product or service … we could represent them as Post It Notes; and suppose we have a clock … we could measure how long the process is taking; and suppose we have our coin … we can simulate the yield of the step; … and suppose we do not start the lead time clock until we start the work for each customer.

We now have the necessary and sufficient components to assemble a simple simulation model of our system … a model that will give us realistic answers to our questions.

So let us see what happens … just click the ‘Start Game’ button.

Http iframes are not shown in https pages in many major browsers. Please read this post for details.


It is worth running this exercise about a dozen times and recording the data for each run … then plotting the results on a time-series chart.

The data to plot is the make-time (which is the time displayed on the top left) and the cost (which is display top middle).

The make-time is the time from starting the first game to completing the last task.

The cost is the number of coin tosses we needed to do to deliver all work to the required standard.

And here are the charts from my dozen runs (yours will be different).

PostItNote_MakeTimeChart

PostItNote_CostChart

The variation from run to run is obvious; as is the correlation between a make-time and a high cost.

The charts also answer our two questions … a make time up to 90 would not be exceptional and an average cost of 10 implies that is the minimum price we need to charge in order to stay in business.

Our customers are waiting while we check-and-correct our own errors and we are expecting them to pay for the extra work!

In the NHS we have a name for this low-quality high-cost design: Payment By Results.


The charts also show us what is possible … a make time of 20 and a cost of 5.

That happened when, purely by chance, we tossed five heads in a row in the Quality Lottery.

So with this insight we could consider how we might increase the probability of ‘throwing a head’ i.e. doing the work right-first-time … because we can see from our charts what would happen.

The improved quality and cost of changing ourselves and our system to remove the root causes of our errors.

Quality Improvement-by-Design.

That something worth learning how to do.

And can we honestly justify not doing it?

Measure and Matter

stick_figure_balance_mind_heart_150_wht_9344Improvement implies learning.  And to learn we need feedback from reality because without it we will continue to believe our own rhetoric.

So reality feedback requires both sensation and consideration.

There are many things we might sense, measure and study … so we need to be selective … we need to choose those things that will help us to make the wise decisions.


Wise decisions lead to effective actions which lead to intended outcomes.


Many measures generate objective data that we can plot and share as time-series charts.  Pictures that tell an evolving story.

There are some measures that matter – our intended outcomes for example. Our safety, flow, quality and productivity charts.

There are some measures that do not matter – the measures of compliance for example – the back-covering blame-avoiding management-by-fear bureaucracy.


And there are some things that matter but are hard to measure … objectively at least.

We can sense them subjectively though.  We can feel them. If we choose to.

And to do that we only need to go to where the people are and the action happens and just watch, listen, feel and learn.  We do not need to do or say anything else.

And it is amazing what we learn in a very short period of time. If we choose to.


If we enter a place where a team is working well we will see smiles and hear laughs. It feels magical.  They will be busy and focused and they will show synergism. The team will be efficient, effective and productive.

If we enter place where is team is not working well we will see grimaces and hear gripes. It feels miserable. They will be busy and focused but they will display antagonism. The team will be inefficient, ineffective and unproductive.


So what makes the difference between magical and miserable?

The difference is the assumptions, attitudes, prejudices, beliefs and behaviours of those that they report to. Their leaders and managers.

If the culture is management-by-fear (a.k.a bullying) then the outcome is unproductive and miserable.

If the culture is management-by-fearlessness (a.k.a. inspiring) then the outcome is productive and magical.

It really is that simple.

Excellent or Mediocre?

smack_head_in_disappointment_150_wht_16653Many organisations proclaim that their mission is to achieve excellence but then proceed to deliver mediocre performance.

Why is this?

It is certainly not from lack of purpose, passion or people.

So the flaw must lie somewhere in the process.


The clue lies in how we measure performance … and to see the collective mindset behind the design of the performance measurement system we just need to examine the key performance indicators or KPIs.

Do they measure failure or success?


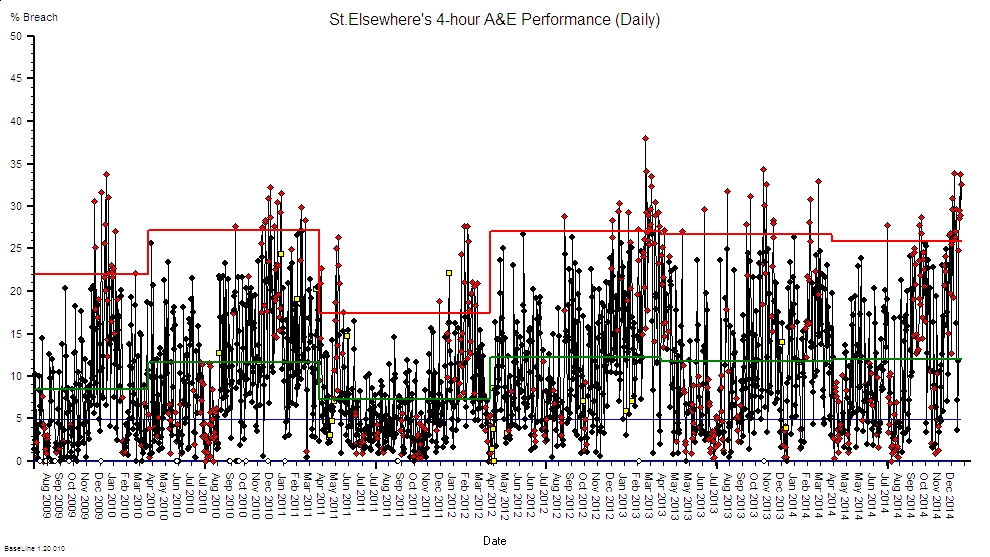
Let us look at some from the NHS …. hospital mortality, hospital acquired infections, never events, 4-hour A&E breaches, cancer wait breaches, 18 week breaches, and so on.

In every case the metric reported is a failure metric. Not a success metric.

And the focus of action is getting away from failure.

Damage mitigation, damage limitation and damage compensation.


So we have the answer to our question: we know we are doing a good job when we are not failing.

But are we?

When we are not failing we are not doing a bad job … is that the same as doing a good job?

Q: Does excellence  = not excrement?

A: No. There is something between these extremes.

The succeed-or-fail dichotomy is a distorting simplification created by applying an arbitrary threshold to a continuous measure of performance.


And how, specifically, have we designed our current system to avoid failure?

Usually by imposing an arbitrary target connected to a punitive reaction to failure. Management by fear.

This generates punishment-avoidance and back-covering behaviour which is manifest as a lot of repeated checking and correcting of the inevitable errors that we find.  A lot of extra work that requires extra time and that requires extra money.

So while an arbitrary-target-driven-check-and-correct design may avoid failing on safety, the additional cost may cause us to then fail on financial viability.

Out of the frying pan and into the fire.

No wonder Governance and Finance come into conflict!

And if we do manage to pull off a uneasy compromise … then what level of quality are we achieving?


Studies show that if take a random sample of 100 people from the pool of ‘disappointed by their experience’ and we ask if they are prepared to complain then only 5% will do so.

So if we use complaints as our improvement feedback loop and we react to that and make changes that eliminate these complaints then what do we get? Excellence?

Nope.

We get what we designed … just good enough to avoid the 5% of complaints but not the 95% of disappointment.

We get mediocrity.


And what do we do then?

We start measuring ‘customer satisfaction’ … which is actually asking the question ‘did your experience meet your expectation?’

And if we find that satisfaction scores are disappointingly low then how do we improve them?

We have two choices: improve the experience or reduce the expectation.

But as we are very busy doing the necessary checking-and-correcting then our path of least resistance to greater satisfaction is … to lower expectations.

And we do that by donning the black hat of the pessimist and we lay out the the risks and dangers.

And by doing that we generate anxiety and fear.  Which was not the intended outcome.


Our mission statement proclaims ‘trusted to achieve excellence’ not ‘designed to deliver mediocrity’.

But mediocrity is what the evidence says we are delivering. Just good enough to avoid a smack from the Regulators.

And if we are honest with ourselves then we are forced to conclude that:

A design that uses failure metrics as the primary feedback loop can achieve no better than mediocrity.


So if we choose  to achieve excellence then we need a better feedback design.

We need a design that uses success metrics as the primary feedback loop and we use failure metrics only in safety critical contexts.

And the ideal people to specify the success metrics are those who feel the benefit directly and immediately … the patients who receive care and the staff who give it.

Ask a patient what they want and they do not say “To be treated in less than 18 weeks”.  In fact I have yet to meet a patient who has even heard of the 18-week target!

A patient will say ‘I want to know what is wrong, what can be done, when it can be done, who will do it, what do I need to do, and what can I expect to be the outcome’.

Do we measure any of that?

Do we measure accuracy of diagnosis? Do we measure use of best evidenced practice? Do we know the possible delivery time (not the actual)? Do we inform patients of what they can expect to happen? Do we know what they can expect to happen? Do we measure outcome for every patient? Do we feed that back continuously and learn from it?

Nope.


So …. if we choose and commit to delivering excellence then we will need to start measuring-4-success and feeding what we see back to those who deliver the care.

Warts and all.

So that we know when we are doing a good job, and we know where to focus further improvement effort.

And if we abdicate that commitment and choose to deliver mediocrity-by-default then we are the engineers of our own chaos and despair.

We have the choice.

We just need to make it.

Bitten by the ISP bug

beehive_bees_150_wht_12723There is a condition called SFQPosis which is an infection that is transmitted by a vector called an ISP.

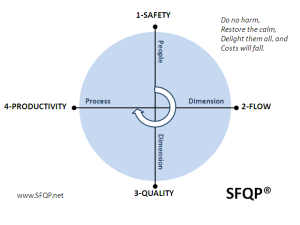
The primary symptom of SFQPosis is sudden clarity of vision and a new understanding of how safety, flow, quality and productivity improvements can happen at the same time …

… when they are seen as partners on the same journey.


There are two sorts of ISP … Solitary and Social.

Solitary ISPs infect one person at a time … often without them knowing.  And there is often a long lag time between the infection and the appearance of symptoms. Sometimes years – and often triggered by an apparently unconnected event.

In contrast the Social ISPs will tend to congregate together and spend their time foraging for improvement pollen and nectar and bringing it back to their ‘hive’ to convert into delicious ‘improvement honey’ which once tasted is never forgotten.


It appears that Jeremy Hunt, the Secretary of State for Health, has recently been bitten by an ISP and is now exhibiting the classic symptoms of SFQPosis.

Here is the video of Jeremy describing his symptoms at the recent NHS Confederation Conference. The talk starts at about 4 minutes.

His account suggests that he was bitten while visiting the Virginia Mason Hospital in the USA and on return home then discovered some Improvement hives in the UK … and some of the Solitary ISPs that live in England.

Warwick and Sheffield NHS Trusts are buzzing with ISPs … and the original ISP that infected them was one Kate Silvester.

The repeated message in Jeremy’s speech is that improved safety, quality and productivity can happen at the same time and are within our gift to change – and the essence of achieving that is to focus on flow.

SFQPThe sequence is safety first (eliminate the causes of avoidable harm), then flow second (eliminate the causes of avoidable chaos), then quality (measure both expectation and experience) and then productivity will soar.

And everyone will  benefit.

This is not a zero-sum win-lose game.


So listen for the buzz of the ISPs …. follow it and ask them to show you how … ask them to innoculate you with SFQPosis.


And here is a recent video of Dr Steve Allder, a consultant neurologist and another ISP that Kate infected with SFQPosis a few years ago.  Steve is describing his own experience of learning how to do Improvement-by-Design.

Too Big To Eat

chained_to_big_weight_ball_anim_10331One of the traps for the less experienced improvement scientist is to take on a project that is too ambitious, too early.

The success with a “small” project will attract the attention of those with an eye on a bigger prize and it is easy to be wooed by the Siren call to sail closer to their Rocks.

This is a significant danger and a warning flag needs to be waved.


Organisations can only take on these bigger challenges after they have developed enough improvement capability themselves … and that takes time and effort.  It is not a quick fix.

And it makes no difference how much money is thrown at the problem.  The requirement is for the leaders to learn how to do it first and that does not take long to do … but it does require some engagement and effort.

And this is difficult for busy people to do …but it is not impossible.


The questions that need to be asked repeatedly are:

1. Is this important enough to dedicate some time to?  If not then do not start.

2. What can I do in the time I can dedicate to this? Delegation is abdication when it comes to improvement.

Those who take on too big a project too early will find it is like being chained to a massive weight … and it gets heavier over time as others add their problems to your heap in the belief that delegating a problem is the same as solving it. It isn’t.


So if your inner voice says “This feels too big for me” then listen to it and ask it what specifically is creating that feeling … work backwards from the feeling.  And only after you have identified the root causes can you make a rational decision.

Then make the decision and stick to it … explaining your reasons.


Study-Plan-Do

knee_jerk_reflexA commonly used technique for continuous improvement is the Plan-Do-Study-Act or PDSA cycle.

This is a derivative of the PDCA cycle first described by Walter Shewhart in the 1930’s … where C is Check.

The problem with PDSA is that improvement does not start with a plan, it starts with some form of study … so SAPD would be a better order.


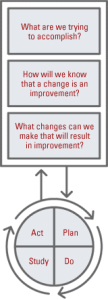
IHI_MFITo illustrate this point if we look at the IHI Model for Improvement … the first step is a pair of questions related to purpose “What are we trying to accomplish?” and “How will we know a change is an improvement?

With these questions we are stepping back and studying our shared perspective of our desired future.

It is a conscious and deliberate act.

We are examining our mental models … studying them … and comparing them.  We have not reached a diagnosis or a decision yet, so we cannot plan or do yet.

The third question is a combination of diagnosis and design … we need to understand our current state in order to design changes that will take up to our improved future state.

We cannot plan what to do or how to do it until we have decided and agreed what the future design will look like, and tested that our proposed future design is fit-4-purpose.


So improvement by discovery or by design does not start with plan, it starts with study.


And another word for study is ‘sense’ which may be a better one … because study implies a deliberate, conscious, often slow process … while sense is not so restrictive.

Very often our actions are not the result of a deliberative process … they are automatic and reflex. We do not think about them. They just sort of happen.

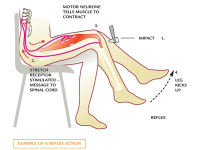
The image of the knee-jerk reflex illustrates the point.

In fact we have little conscious control over these automatic motor reflexes which respond much more quickly than our conscious thinking process can.  We are aware of the knee jerk after it has happened, not before, so we may be fooled into thinking that we ‘Do’ without a ‘Plan’.  But when we look in more detail we can see the sensory input and the hard-wired ‘plan’ that links to to motor output.  Study-Plan-Do.


The same is true for many other actions – our unconscious mind senses, processes, decides, plans and acts long before we are consciously aware … and often the only clue we have is a brief flash of emotion … and usually not even that.  Our behaviour is largely habitual.


And even in situations when we need to make choices the sense-recognise-act process is fast … such as when a patient suddenly becomes very ill … we switch into the Resuscitate mode which is a pre-planned sequence of steps that is guided by what are sensing … but it is not made up on the spot. There is no committee. No meetings. We just do what we have learned and practiced how to do … because it was designed to.   It still starts with Study … it is just that the Study phase is very short … we just need enough information to trigger the pre-prepared plan. ABC – Airway … Breathing … Circulation. No discussion. No debate.


So, improvement starts with Study … and depending on what we sense what happens next will vary … and it will involve some form of decision and plan.

1. Unconscious, hard-wired, knee jerk reflex.
2. Unconscious, learned, habitual behaviour.
3. Conscious, pre-planned, steered response.
4. Conscious, deliberation-diagnosis-design then delivery.

The difference is just the context and the timing.   They are all Study-Plan-Do.

 And the Plan may be to Do Nothing …. the Deliberate Act of Omission.


And when we go-and-see and study the external reality we sometimes get a surprise … what we see is not what we expect. We feel a sense of confusion. And before we can plan we need to adjust our mental model so that it better matches reality. We need to establish clarity.  And in this situation we are doing Study-Adjust-Plan-Do …. S(A)PD.

Mono, Micro, Meso and Macro

missing_custom_puzzle_completionSystems are made up of inter-dependent parts. And each part is a smaller system made up of inter-dependent parts. And so on.

But there is a limit … eventually we reach a size where we only have a small number of independent parts … and that is called a micro-system.

It is part of a meso-system which in turn is part of a macro-system.


And it appears that in human systems the manageable size of a micro-system is about seven people – enough to sit around a table and work together on a problem.


So the engine of organisational improvement is many micro-systems of about seven people who are able to solve the problems that fall within their collective circles of control.

And that means the vast majority of problems are solvable at the micro-system level.

In fact, without this foundation level of competent and collaborative micro-teams, the meso-systems and the macro-systems cannot get a grip on the slippery problem of systemic change for the better.


The macro-system is also critical to success because it has the strategic view and it sets the vision and values to which every other part of the system aligns.  A dysfunctional macro-system sends cracks down through the whole organisation … fragmenting it into antagonistic, competiting silos.


The meso-system level is equally critical to success because it translates the strategy into tactics and creates the context for the multitude of micro-systems to engage.

The meso-system is the nervous system of the organisation … the informal communication network that feeds data and decisions around.

And if the meso-system is dysfunctional then the organisation can see, feel and move … but it is uncoordinated, chaotic, inefficient, ineffective and largely unproductive.


So the three levels are different, essential and inter-dependent.

The long term viability of a complex adaptive system is the emergent effect of a system design that is effective and efficient. Productive. Collaborative. Synergistic.

And achieving that is not easy … but it is possible.

And for each of us it starts with just us … Mono. 

The Slippery Slope From Calm To Chaos

figure_slipping_on_water_custom_sign_14210System behaviour is often rather variable over the short term.  We have ‘good’ days and ‘bad’ days and we weather the storm because we know the sun will shine again soon.

We are resilient and adaptable. And our memories are poor.

So when the short-term variation sits on top of a long-term trend then we do not feel the trend …

… because we are habituating. We do not notice that we are on a slippery slope.


And slippery slopes are more difficult to climb up than to slide down.


In organisational terms the slippery slope is from Calm to Chaos.  Success to Failure.  Competent to Incompetent. Complacent to  Contrite.  Top of the pops to top of the flops!

The primary reason for this is we are all part of a perpetual dynamic between context and content.  We are affected by the context we find ourselves in. We sense it and that influences our understanding, our decisions and our actions. These actions then change our context … nothing is ever the same.

So our hard-won success sows the seeds of its own failure … and unless we realise that then we are doomed to a boom-bust cycle.  To sustain success we must learn to constantly redefine our future and redesign our present.


If we do not then we are consigned to the Slippery Slope … and when we eventually accept that chaos has engulfed us then we may also discover that it may be late.  To leap from chaos to calm is VERY difficult without a deep understanding of how systems work … and if we had that wisdom then we would have avoided the slippery slope in the first place.


The good news is that there is hope … we can learn to climb out of the Swamp of Chaos … and we can develop our capability to scale the slippery slope from  Chaos through Complex, and then to Complicated, and finally back to Calm.  Organised complexity.

It requires effort and it takes time … but it is possible.

Celebrate and Share

There comes a point in every improvement journey when it is time to celebrate and share. This is the most rewarding part of the Improvement Science Practitioner (ISP) coaching role so I am going to share a real celebration that happened this week.

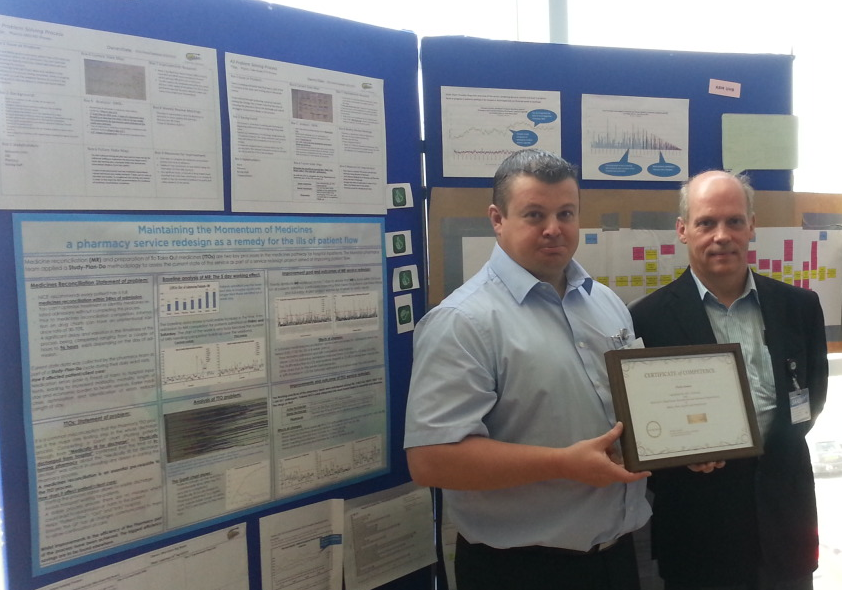
The picture shows Chris Jones holding his well-earned ISP-1 Certificate of Competence.  The “Maintaining the Momentum of Medicines”  redesign project is shown on the poster on the left and it is the tangible Proof of Competence. The hard evidence that the science of improvement delivers.

Chris_Jones_Poster_and_Certificate

Behind us are the A3s for one of the Welsh Health Boards;  ABMU in fact.


An A3 is a way of summarising an improvement project very succinctly – the name comes from the size of paper used.  A3 is the biggest size that will go through an A4 fax machine (i.e. folded over) and the A3 discipline is to be concise and clear at the same time.

The three core questions that the A3 answers are:
Q1: What is the issue?
Q2: What would improvement need to look like?
Q3: How would we know that a change is an improvement?

This display board is one of many in the room, each sharing a succinct story of a different improvement journey and collectively a veritable treasure trove of creativity and discovery.

The A3s were of variable quality … and that is OK and is expected … because like all skills it takes practice. Lots of practice. Perfection is not the goal because it is unachievable. Best is not the goal because only one can be best. Progress is the goal because everyone can progress … and so progress is what we share and what we celebrate.


The event was the Fifth Sharing Event in the Welsh Flow Programme that has been running for just over a year and Chris is the first to earn an ISP-1 Certificate … so we all celebrated with him and shared the story.  It is a team achievement – everyone in the room played a part in some way – as did many more who were not in the room on the day.


stick_figure_look_point_on_cliff_anim_8156Improvement is like mountain walking.

After a tough uphill section we reach a level spot where we can rest; catch our breath; take in the view; reflect on our progress and the slips, trips and breakthroughs along the way; perhaps celebrate with drink and nibble of our chocolate ration; and then get up, look up, and square up for the next uphill bit.

New territory for us.  New challenges and new opportunities to learn and to progress and to celebrate and share our improvement stories.

The Improvement Gearbox

GearboxOne of the most rewarding experiences for an improvement science coach is to sense when an individual or team shift up a gear and start to accelerate up their learning curve.

It is like there is a mental gearbox hidden inside them somewhere.  Before they were thrashing themselves by trying to go too fast in a low gear. Noisy, ineffective, inefficient and at high risk of blowing a gasket!

Then, they discover that there is a higher gear … and that to get to it they have to take a risk … depress the emotional clutch, ease back on the gas, slip into neutral, and trust themselves to find the new groove and … click … into the higher gear, and then ease up the power while letting out the clutch.  And then accelerate up the learning  curve.  More effective, more efficient. More productive. More fun.


Organisations appear to behave in much the same way.

Some scream along in the slow-lane … thrashing their employee engine. The majority chug complacently in the middle-lane of mediocrity. A few accelerate past in the fast-lane to excellence.

And they are all driving exactly the same model of car.

So it is not the car that is making the difference … it is the driving.


Those who have studied organisations have observed five cultural “gears”; and which gear an organisation is in most of the time can be diagnosed by listening to the sound of the engine – the conversations of the employees.

If they are muttering “work sucks” then they are in first gear.  The sense of hopelessness, futility, despair and anger consumes all their emotional fuel. Fortunately this is uncommon.

If we mainly hear “my work sucks” then they are in second gear.  The feeling is of helplessness and apathy and the behaviour is Victim-like.  They believe that they cannot solve their own problems … someone else must do it for them or tell them what to do. They grumble a lot.

If the dominant voice is “I’m great but you lot suck” then we are hearing third gear attitudes. The selfishly competitive behaviour of the individualist achiever. The “keep your cards close to your chest” style of dyadic leadership.  The advocate of “it is OK to screw others to get ahead”. They grumble a lot too – about the apathetic bunch.

And those who have studied organisations suggest that about 80% of healthcare organisations are stuck in first, second or third cultural gear.  And we can tell who they are … the lower 80% of the league tables. The ones clamouring for more … of everything.


So how come so many organisations are so stuck? Unable to find fourth gear?

One cause is the design of their feedback loops. Their learning loops.

If an organisation only uses failure as a feedback loop then it is destined to get no more than mediocrity.  Third gear at best, and usually only second.

Example.
We all feel disappointment when our experience does not live up to our expectation.  But only the most angry of us will actually do something and complain.  Especially when we have no other choice of provider!

Suppose we are commissioners of healthcare services and we are seeing a rising tide of patient and staff complaints. We want to improve the safety and quality of the services that we are paying for; so we draw up a league table using complaints as feedback fodder and we focus on the worst performing providers … threatening them with dire consequences for being in the bottom 20%.  What happens? Fear of failure motivates them to ‘pull up their socks’ and the number of complaints falls.

Job done?

Unfortunately not.

All we have done is to bully those stuck in first or second gear into thrashing their over-burdened employee engine even harder.  We have not helped anyone find their higher gear. We have hit the target, missed the point, and increased the risk of system failure!

So what about those organisations stuck in third gear?

Well they are ticking their performance boxes, meeting our targets, keeping their noses clean.  Some are just below, and some just above the collective mean of barely acceptable mediocrity.

But expectation is changing.

The 20% who have discovered fourth gear are accelerating ahead and are demonstrating what is possible. And they are raising expectation, increasing the variation of service quality … for the better.

And the other 80% are falling further and further behind; thrashing their tired and demoralised staff harder and harder to keep up.  Complaining increasingly that life is unfair and that they need more, time, money and staff engagement. Eventually their executive head gaskets go “pop” and they fall by the wayside.


Finding cultural fourth gear is possible but it is not easy. There are no short cuts.  We have to work our way up the gears and we have to learn when and how to make smooth transitions from first to second, second to third and then third to fourth.

And when we do that the loudest voice we hear is “We are OK“.

We need to learn how to do a smooth cultural hill start on the steep slope from apathy to excellence.

And we need to constantly listen to the sound of our improvement engine; to learn to understand what it is saying; and learn how and when to change to the next cultural gear.

Circles

SFQP_enter_circle_middle_15576For a system to be both effective and efficient the parts need to work in synergy. This requires both alignment and collaboration.

Systems that involve people and processes can exhibit complex behaviour. The rules of engagement also change as individuals learn and evolve their beliefs and their behaviours.

The values and the vision should be more fixed. If the goalposts are obscure or oscillate then confusion and chaos is inevitable.


So why is collaborative alignment so difficult to achieve?

One factor has been mentioned. Lack of a common vision and a constant purpose.

Another factor is distrust of others. Our fear of exploitation, bullying, blame, and ridicule.

Distrust is a learned behaviour. Our natural inclination is trust. We have to learn distrust. We do this by copying trust-eroding behaviours that are displayed by our role models. So when leaders display these behaviours then we assume it is OK to behave that way too.  And we dutifully emulate.

The most common trust eroding behaviour is called discounting.  It is a passive-aggressive habit characterised by repeated acts of omission:  Such as not replying to emails, not sharing information, not offering constructive feedback, not asking for other perspectives, and not challenging disrespectful behaviour.


There are many causal factors that lead to distrust … so there is no one-size-fits-all solution to dissolving it.

One factor is ineptitude.

This is the unwillingness to learn and to use available knowledge for improvement.

It is one of the many manifestations of incompetence.  And it is an error of omission.


Whenever we are unable to solve a problem then we must always consider the possibility that we are inept.  We do not tend to do that.  Instead we prefer to jump to the conclusion that there is no solution or that the solution requires someone else doing something different. Not us.

The impossibility hypothesis is easy to disprove.  If anyone has solved the problem, or a very similar one, and if they can provide evidence of what and how then the problem cannot be impossible to solve.

The someone-else’s-fault hypothesis is trickier because proving it requires us to influence others effectively.  And that is not easy.  So we tend to resort to easier but less effective methods … manipulation, blame, bullying and so on.


A useful way to view this dynamic is as a set of four concentric circles – with us at the centre.

The outermost circle is called the ‘Circle of Ignorance‘. The collection of all the things that we do not know we do not know.

Just inside that is the ‘Circle of Concern‘.  These are things we know about but feel completely powerless to change. Such as the fact that the world turns and the sun rises and falls with predictable regularity.

Inside that is the ‘Circle of Influence‘ and it is a broad and continuous band – the further away the less influence we have; the nearer in the more we can do. This is the zone where most of the conflict and chaos arises.

The innermost is the ‘Circle of Control‘.  This is where we can make changes if we so choose to. And this is where change starts and from where it spreads.


SFQP_enter_circle_middle_15576So if we want system-level improvements in safety, flow, quality and productivity (or cost) then we need to align these four circles. Or rather the gaps in them.

We start with the gaps in our circle of control. The things that we believe we cannot do … but when we try … we discover that we can (and always could).

With this new foundation of conscious competence we can start to build new relationships, develop trust and to better influence others in a win-win-win conversation.

And then we can collaborate to address our common concerns – the ones that require coherent effort. We can agree and achieve our common purpose, vision and goals.

And from there we will be able to explore the unknown opportunities that lie beyond. The ones we cannot see yet.

The Nanny McPhee Coaching Contract

Nanny_McPheeThere comes a point in every improvement-by-design journey when it is time for the improvement guide to leave.

An experienced improvement coach knows when that time has arrived and the expected departure is in the contract.

The Nanny McPhee Coaching Contract:

“When you need me but do not want me then I have to stay. And when you want me but do not need me then I have to leave.”


The science of improvement can appear like ‘magic’ at first because seemingly impossible simultaneous win-win-win benefits are seen to happen with minimal effort.

It is not magic.  It requires years of training and practice to become a ‘magician’.  So those who have invested in learning the know-how are just catalysts.  When their catalysts-of-change work is done then they must leave to do it elsewhere.

The key to managing this transition is to set this expectation clearly and right at the start; so it does not come as a surprise. And to offer reminders along the way.

And it is important to follow through … when the time is right.


It is not always easy though.

There are three commonly encountered situations that will test the temptation of the guide.

1) When things are going very badly because the coaching contract is being breached; usually by old, habitual, trust-eroding, error-of-omission behaviours such as: not communicating, not sharing learning, and not delivering on commitments. The coach, fearing loss of reputation and face, is tempted to stay longer and to try harder. Often getting angry and frustrated in the process.  This is an error of judgement. If the coaching contract is being persistently breached then the Exit Clause should be activated clearly and cleanly.

2) When things are going OK, it is easy to become complacent and the temptation then is to depart too soon, only to hear later that the solo-flyers “crashed and burned”, because they were not quite ready and could not (or would not) see it.  This is the “need but do not want” part of the Nanny McPhee Coaching Contract.  One role of the coach is to respectfully challenge the assertion that ‘We can do it ourselves‘ … by saying ‘OK, please demonstrate‘.

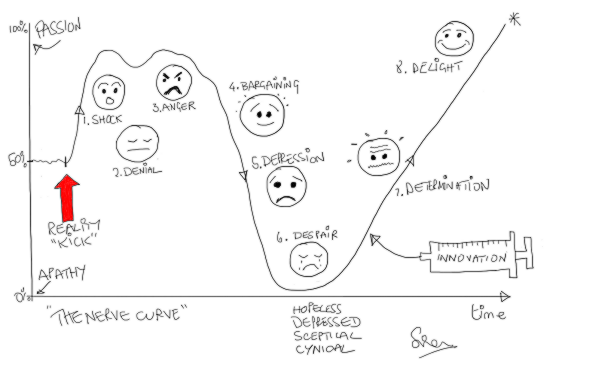
3) When things are going very well it is tempting to blow the Trumpet of Success too early, attracting the attention of others who will want to take short cuts, to bypass the effort of learning for themselves, and to jump onto someone else’s improvement bus.  The danger here is that they bring their counter-productive, behavioural baggage with them. This can cause the improvement bus to veer off course on the twists and turns of the Nerve Curve; or grind to a halt on the steeper parts of the learning curve.


An experienced improvement coach will respectfully challenge the individuals and the teams to help them develop their experience, competence and confidence. And just as they start to become too comfortable with having someone to defer to for all decisions, the coach will announce their departure and depart as announced.

This is the “want but do not need” part of the Nanny McPhee Coaching Contract.


And experience teaches us that this mutually respectful behaviour works better.

Politicial Purpose

count_this_vote_400_wht_9473The question that is foremost in the mind of a designer is “What is the purpose?”   It is a future-focussed question.  It is a question of intent and outcome. It raises the issues of worth and value.

Without a purpose it impossible to answer the question “Is what we have fit-for-purpose?

And without a clear purpose it is impossible for a fit-for-purpose design to be created and tested.

In the absence of a future-purpose all that remains are the present-problems.

Without a future-purpose we cannot be proactive; we can only be reactive.

And when we react to problems we generate divergence.  We observe heated discussions. We hear differences of opinion as to the causes and the solutions.  We smell the sadness, anger and fear. We taste the bitterness of cynicism. And we are touched to our core … but we are paralysed.  We cannot act because we cannot decide which is the safest direction to run to get away from the pain of the problems we have.


And when the inevitable catastrophe happens we look for somewhere and someone to place and attribute blame … and high on our target-list are politicians.


So the prickly question of politics comes up and we need to grasp that nettle and examine it with the forensic lens of the system designer and we ask “What is the purpose of a politician?”  What is the output of the political process? What is their intent? What is their worth? How productive are they? Do we get value for money?

They will often answer “Our purpose is to serve the public“.  But serve is a verb so it is a process and not a purpose … “To serve the public for what purpose?” we ask. “What outcome can we expect to get?” we ask. “And when can we expect to get it?

We want a service (a noun) and as voters and tax-payers we have customer rights to one!

On deeper reflection we see a political spectrum come into focus … with Public at one end and Private at the other.  A country generates wealth through commerce … transforming natural and human resources into goods and services. That is the Private part and it has a clear and countable measure of success: profit.  The Public part is the redistribution of some of that wealth for the benefit of all – the tax-paying public. Us.

Unfortunately the Public part does not have quite the same objective test of success: so we substitute a different countable metric: votes. So the objectively measurable outcome of a successful political process is the most votes.

But we are still talking about process … not purpose.  All we have learned so far is that the politicians who attract the most votes will earn for themselves a temporary mandate to strive to achieve their political purpose. Whatever that is.

So what do the public, the voters, the tax-payers (and remember whenever we buy something we pay tax) … the customers of this political process … actually get for their votes and cash?  Are they delighted, satisfied or disappointed? Are they getting value-for-money? Is the political process fit-for-purpose? And what is the purpose? Are we all clear about that?

And if we look at the current “crisis” in health and social care in England then I doubt that “delight” will feature high on the score-sheet for those who work in healthcare or for those that they serve. The patients. The long-suffering tax-paying public.


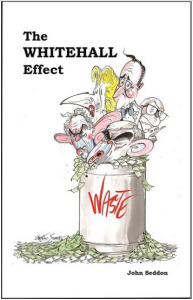
Are politicians effective? Are they delivering on their pledge to serve the public? What does the evidence show?  What does their portfolio of public service improvement projects reveal?  Welfare, healthcare, education, police, and so on.The_Whitehall_Effect

Well the actual evidence is rather disappointing … a long trail of very expensive taxpayer-funded public service improvement failures.

And for an up-to-date list of some of the “eye-wateringly”expensive public sector improvement train-wrecks just read The Whitehall Effect.

But lurid stories of public service improvement failures do not attract precious votes … so they are not aired and shared … and when they are exposed our tax-funded politicians show their true skills and real potential.

Rather than answering the questions they filter, distort and amplify the questions and fire them at each other.  And then fall over each other avoiding the finger-of-blame and at the same time create the next deceptively-plausible election manifesto.  Their food source is votes so they have to tickle the voters to cough them up. And they are consummate masters of that art.

Politicians sell dreams and serve disappointment.


So when the-most-plausible with the most votes earn the right to wield the ignition keys for the engine of our national economy they deflect future blame by seeking the guidance of experts. And the only place they can realistically look is into the private sector who, in manufacturing anyway, have done a much better job of understanding what their customers need and designing their processes to deliver it. On-time, first-time and every-time.

Politicians have learned to be wary of the advice of academics – they need something more pragmatic and proven.  And just look at the remarkable rise of the manufacturing phoenix of Jaguar-Land-Rover (JLR) from the politically embarrassing ashes of the British car industry. And just look at Amazon to see what information technology can deliver!

So the way forward is blindingly obvious … combine manufacturing methods with information technology and build a dumb-robot manned production-line for delivering low-cost public services via a cloud-based website and an outsourced mega-call-centre manned by standard-script-following low-paid operatives.


But here we hit a bit of a snag.

Designing a process to deliver a manufactured product for a profit is not the same as designing a system to deliver a service to the public.  Not by a long chalk.  Public services are an example of what is now known as a complex adaptive system (CAS).

And if we attempt to apply the mechanistic profit-focussed management mantras of “economy of scale” and “division of labour” and “standardisation of work” to the messy real-world of public service then we actually achieve precisely the opposite of what we intended. And the growing evidence is embarrassingly clear.

We all want safer, smoother, better, and more affordable public services … but that is not what we are experiencing.

Our voted-in politicians have unwittingly commissioned complicated non-adaptive systems that ensure we collectively fail.

And we collectively voted the politicians into power and we are collectively failing to hold them to account.

So the ball is squarely in our court.


Below is a short video that illustrates what happens when politicians and civil servants attempt complex system design. It is called the “Save the NHS Game” and it was created by a surgeon who also happens to be a system designer.  The design purpose of the game is to raise awareness. The fundamental design flaw in this example is “financial fragmentation” which is the the use of specific budgets for each part of the system together with a generic, enforced, incremental cost-reduction policy (the shrinking budget).  See for yourself what happens …


In health care we are in the improvement business and to do that we start with a diagnosis … not a dream or a decision.

We study before we plan, and we plan before we do.

And we have one eye on the problem and one eye on the intended outcome … a healthier patient.  And we often frame improvement in the negative as a ‘we do not want a not sicker patient’ … physically or psychologically. Primum non nocere.  First do no harm.

And 99.9% of the time we do our best given the constraints of the system context that the voted-in politicians have created for us; and that their loyal civil servants have imposed on us.


Politicians are not designers … that is not their role.  Their part is to create and sell realistic dreams in return for votes.

Civil servants are not designers … that is not their role.  Their part is to enact the policy that the vote-seeking politicians cook up.

Doctors are not designers … that is not their role.  Their part is to make the best possible clinical decisions that will direct actions that lead, as quickly as possible, to healthier and happier patients.

So who is doing the complex adaptive system design?  Whose role is that?

And here we expose a gap.  No one.  For the simple reason that no one is trained to … so no one is tasked to.

But there is a group of people who are perfectly placed to create the context for developing this system design capability … the commissioners, the executive boards and the senior managers of our public services.

So that is where we might reasonably start … by inviting our leaders to learn about the science of complex adaptive system improvement-by-design.

And there are now quite a few people who can now teach this science … they are the ones who have done it and can demonstrate and describe their portfolios of successful and sustained public service improvement projects.

Would you vote for that?

Learning Loops

campfire_burning_150_wht_174[Beep Beep] Bob’s phone reminded him that it was time for the remote coaching session with Leslie, one of the CHIPs (community of healthcare improvement science practitioners). He flipped open his laptop and logged in. Leslie was already there.

<Leslie> Hi Bob.  I hope you had a good Xmas.

<Bob> Thank you Leslie. Yes, I did. I was about to ask the same question.

<Leslie> Not so good here I am afraid to say. The whole urgent care system is in meltdown. The hospital is gridlocked, the 4-hour target performance has crashed like the Stock Market on Black Wednesday, emergency admissions have spilled over into the Day Surgery Unit, hundreds of operations have been cancelled, waiting lists are spiralling upwards and the fragile 18-week performance ceiling has been smashed. It is chaos. Dangerous chaos.

<Bob> Oh dear. It sounds as if the butterfly has flapped its wings. Do you remember seeing this pattern of behaviour before?

<Leslie> Sadly yes. When I saw you demonstrate the Save the NHS Game.  This is exactly the chaos I created when I attempted to solve the 4-hour target problem, and the chaos I have seen every doctor, manager and executive create when they do too. We seem to be the root cause!

<Bob> Please do not be too hard on yourself Leslie. I am no different. I had to realise that I was contributing to the chaos I was complaining about, by complaining about it. Paradoxically not complaining about it made no difference. My error was one of omission. I was not learning. I was stuck in a self-justifying delusional blame-bubble of my own making. My humility and curiosity disabled by my disappointment, frustration and anxiety. My inner chimp was running the show!

<Leslie> Wow! That is just how everyone is feeling and behaving. Including me. So how did you escape from the blame-bubble?

<Bob> Well first of all I haven’t completely escaped. I just spend less time there. It is always possible to get sucked back in. The way out started to appear when I installed a “learning loop”.

<Leslie> A what? Is that  like a hearing loop for the partially deaf?

<Bob> Ha! Yes! A very apt metaphor.  Yes, just like that. Very good. I will borrow that if I may.

<Leslie> So what did your learning loop consist of?

<Bob> A journal.  I started a journal. I invested a few minutes each day reflecting and writing it down. The first entries were short and rather “ranty”. I cannot possibly share them in public. It is too embarrassing. But it was therapeutic and over time the anger subsided and a quieter, calmer inner voice could be heard. The voice of curiosity. It was asking one question over and over again. “How?” … not “Why?”.

<Leslie> Like “How did I get myself into this state?

<Bob> Exactly so.  And also “How come I cannot get myself out of this mess?

<Leslie> And what happened next?

<Bob> I started to take more notice of things that I had discounted before. Apparently insignificant things that I discovered had profound implications. Like the “butterflies wing” effect … I discovered that small changes can have big effects.  I also learned to tune in to specific feelings because they were my warning signals.

<Leslie> Niggles you mean?

<Bob> Yes. Niggles are flashes of negative emotion that signal a design flaw. They are usually followed by an untested assumption, an invalid conclusion, an unwise decision and a counter-productive action. It all happens unconsciously and very fast so we are only aware of the final action – the MR ANGRY reply to the email that we stupidly broadcast via the Reply All button!

<Leslie> So you learned to tune into the niggle to avoid the chain reaction that led to hitting the Red Button.

<Bob> Sort of. What actually happened is that the passion unleashed by the niggle got redirected into a more constructive channel – via my Curiosity Centre to power up the Improvement Engine. It was a bit rusty! It had not been used for a long while.

<Leslie> And once the “engine” was running it sucked in niggles that were now a source of fuel! You started harvesting them using the 4N Chart! So what was the output?

<Bob> Purposeful, focused, constructive, rational actions. Not random, destructive, emotional explosions.

<Leslie> Constructive actions such as?

<Bob> Well designing and building the FISH course is one, and this ISP programme is another.

<Leslie> More learning loops!

<Bob> Yup.

<Leslie> OK. So I can see that a private journal can help an individual to build their own learning loop. How does that work with groups? We do not all need to design and build a FISH-equivalent surely!

<Bob> No indeed. What we do is we share stories. We gather together in small groups around camp fires and we share what we are learning … as we are learning it. We contribute our perspective to the collective awareness … and we all gain from everyone’s learning. We learn and teach together.

<Leslie> So the stories are about what we are learning, not what we achieved with that learning.

<Bob> Well put! The “how” we achieved it is more valuable knowledge than “what” we achieved. The “how” is the process, the “what” is just the product. And the “how” we failed to achieve is even more valuable.

<Leslie> Wow! So are you saying that the chaos we are experiencing is the expected effect of not installing enough learning loops! A system-wide error of omission.

<Bob> I would say that is a reasonable diagnosis.

<Leslie> So a rational and reasonable course of treatment becomes clear.  I am on the case!

SFQP

SFQPThe flavour of the week has been “chaos”.  Again!

Chaos dissipates energy faster than calm so chaotic behaviour is a symptom of an inefficient design.

And we would like to improve our design to restore a state of ‘calm efficiency’.

Chaos is a flow phenomenon … but that is not where the improvement by design process starts.  There is a step before that … Safety.


Safety First
If a design is unsafe it generates harm.  So we do not want to improve the smooth efficiency of the harm generator … that will only produce more harm!  First we must consider if our system is safe enough.

Despite what many claim, our healthcare systems are actually very safe.  For sure there are embarrassing exceptions and we can always improve safety further, but we actually have quite a safe design.

It is not a very efficient design though.  There is a lot of checking and correcting which uses up time and resources … but it helps to ensure safety is good enough for now.

Having done the safety sanity check we can move on to Flow.


Flow Second
Flow comes before quality because it is impossible to deliver a high quality experience in a chaotic system.  First we need to calm any chaos.  Or rather we need to diagnose the root causes of the chaotic behaviour and do some flow re-design to restore the calm.

Chaos is funny stuff.  It does not behave intuitively.  Time is always a factor.  The butterflies wing effect is ever present.  Small causes can have big effects, both good and bad.  Big causes can have no effect.  Causes can be synergistic and they can be antagonistic.  The whole is not the sum of the parts.  This confusing and counter-intuitive behaviour is called “non linear” and we are all rubbish at getting a mental handle on it.  Our brains did not evolve that way.

The good news is that when chaos reigns it is usually possible to calm it with a small number of carefully placed, carefully timed, carefully designed, synergistic, design “tweaks”.

The problem is that when we do what intuitively feels “right” we can too easily make poor improvement decisions that lead to ineffective actions.  The chaos either does not go away or it gets worse.  So, we have learned from our ineptitude to just put up with the chaos and to accept the inefficiency, the high cost-of-chaos.

To calm the chaos we have to learn how to use the tools designed to do that.  And they do exist.


Quality
Safety and Flow represent the “absolute” half of the SFQP cycle.  Harm is an absolute metric. We can devise absolute definitions and count harmful events.  Mortality.  Mistakes.  Hospital  acquired infections.  That sort of stuff.

Flow is absolute too in the sense that the Laws of Physics determine what happens, and they are absolute too. And non-negotiable.

Quality is relative.  It is the ratio of experience and expectation and both of these are subjective but that is not the point.  The point is that it is a ratio and that makes it a relative metric.  My expectation influences my perception of quality, as does what I experience.  And this has important implications.  For example we can reduce disappointment by lowering expectation; or we can reduce disappointment by improving experience.  Lowering expectation is the easier option because to do that we only have to don the “black hat” and paint a grisly picture of a worst case scenario.  Some call it “informed consent”; I call it “abdication of empathy” and “fear-mongering”.

Variable quality can  come from variable experience, variable expectation or both.  So, to reduce quality variation we can focus on either input to the ratio; and the easiest is expectation.  Setting a realistic expectation just requires measuring experience retrospectively and sharing it prospectively.  Not satisfaction mind you – Experience. Satisfaction surveys are largely meaningless as an improvement tool because just setting a lower expectation will improve satisfaction!

And this is why quality follows flow … because if flow is chaotic then expectation becomes a lottery, and quality does too.  The chaotic behaviour of the St.Elsewhere’s® A&E Department that we saw last week implies that we cannot set any other expectation than “It might be OK or it might be Not OK … we cannot predict. So fingers crossed.”  It is a quality lottery!

But with calm and efficient flow we experience less variation and with that we can set a reasonable expectation.  Quality becomes predictable-within-limits.


Productivity
Productivity is also a relative concept.  It is the ratio of what we get out of the system divided by what we put in.  Revenue divided by expense for example.

And it does not actually emerge last.  As soon as safety, flow or quality improve then they will have an immediate impact on productivity.  Work gets easier.  The cost of harm, chaos and disappointment will fall (and they are surprisingly large costs!).

The reason that productivity-by-design comes last is because we are talking about focussed productivity improvement-by-design.  Better value for money.  And that requires a specific design focus.  And it comes last because we need some head-space and some life-time to learn and do good system design.

And SFQP is a cycle so after doing the Productivity improvement we go back to Safety and ask “How can we make our design even safer and even simpler?” And so on, round and round the SFQP loop.

Do no harm, restore the calm, delight for all, and costs will fall.

And if you would like a full-size copy of the SFQP cycle diagram to use and share just click here.

Magnum Chaos

Magnum_ChaosThe title of this alter piece by Lorenzo Lotto is Magnum Chaos. It was painted in the first half of the 16th Century.

Chaos was the Greek name for the primeval state of existence from which everything that has order was created. Similar concepts exist in all ancient mythologies.

The sudden appearance of order from chaos is the subject of much debate and current astronomical science refers to it as the Big Bang … which is the sense that this 500 year old image captures.  Except that it appears to have happened bout 13.5 thousand million years ago.

So it is surprising to learn that the Science of Chaos did not really get going until about 50 years ago – shortly after the digital computer was developed.


The timing is no co-incidence.  The theoretical roots of chaos had been known for much longer – since Isaac Newton formulated the concept of gravity. About 200 years ago it became the “Three-Body Problem”. The motion of the Earth, Moon and Sun is a three-body gravitational problem.

And in 1887, mathematicians Ernst Bruns and Henri Poincaré showed that there is no general analytical solution for the three-body problem given by algebraic expressions and integrals. The motion of three bodies is generally non-repeating, except in special cases. No simple equation describes it.

The implication of this is that the only way to solve this sort of problem is by grunt-work, empirically, with thousands of millions of small calculations.  And in 1887 the technology was not available to do this.


So when the high-speed transistorised digital computer appeared in the 1960’s it became possible to revisit this old niggle … and the nature of chaos became much better understood.  The modern legacy of this pioneering work is the surprising accuracy that we can now predict the weather – at least over the short term – using powerful digital computers running chaotic system simulation models. Weather is a chaotic flow system.

So given the knowledge that exists about the nature of flow in naturally chaotic systems … it is surprising that not much of this understanding has diffused into the design of man-made systems; such as healthcare.


It has probably not escaped most people’s attention that the NHS is suffering yet another “winter crisis” … despite the fact that the NHS budget has doubled over the last 15 years.

If we can predict the weather, but not control it, then why cannot we avoid the annual NHS crisis – which is a much simpler system that we can influence?


StElsewhere_Fail
The chart above shows the actual behaviour of a healthcare system – a medium sized hospital that we shall call St.Elsewhere’s®.  It could be called St.Anywhere’s.  The performance metric that is being plotted over time is the % of patients who arrive each day in the A&E department and who are there for more than 4 hours. The infamous 4-hour A&E target.  The time-span on the horizontal axis is just over 5 years – and the data has been segmented by financial year.

The behaviour of this system over time is not random.  It is chaotic.

There are repeating but non-identical cyclical patterns in the data … for example the first half of the year (April to September) is “better” than the second half. And this cyclical pattern appears to be changing as time passes.

The thin blue line is the arbitrary ‘target’.  And it does require a statistical expert to conclude that this system has never come close to achieving the ‘target’.  The system design is not capable of achieving it … so beating the system with a stick is not going to help. It amounts to the Basil Fawlty tactic of beating the broken-down car with a tree branch!

The system needs to be re-designed in order to achieve the requirement of consistently less than a 5% failure rate on the 4-hour A&E target. Exhortation is ineffective.

And this is not a local problem … it is a systemic one … BBC News


To re-design a system to achieve improved performance we first need to understand why the current design is not demonstrating the behaviour we want. Guessing is not design. It is guess-work. Generating a hypothesis is not design. It is guess-work too.

Design requires understanding.

A common misunderstanding is that the primary cause of deteriorating A&E performance is increasing demand. Reality does not support this rhetoric.

StElsewhere_DemandThis system behaviour chart (SBC) shows the A&E daily demand for the same period segmented by financial year. Over time there has indeed been an increase in the average demand, but that association does not prove causality.  If increasing demand caused performance failure we would expect to see matching cyclical patterns on both charts. But it is rather obvious that there is little relation between the two charts – the periods of highest demand do not correlate with the periods of highest failure. If anything there is a negative correlation – there is actually less demand in the second half of the financial year compared with the first.

So there must be more to it than just the average A&E demand.  Could there be a chicken-and-egg problem here? Higher breach rates leading to lower demand? Word gets round about a poor quality service!  What about the weather?  What about the effect of day-length? What about holidays? What about annual budgets?

What is uncomfortably obvious is that the chaotic behaviour has been going on for a long time. That is because it is an inherent part of the design.  We created it because we designed the NHS.


One surprising lesson that Chaos Theory teaches us is that chaos is predictable.  A system can be designed to behave chaotically … and rather easily too. It does not required a complicated design – a mechanically simple system can behave chaotically – a hinged pendulum for example.

So if we can deliberately design a system to behave chaotically then surely we can understand what design features are critical to delivering chaos and what are not. And with that insight might we then examine the design of man-made systems that we do not want to behave chaotically … such as our healthcare system?

And when we do that we discover something rather uncomfortable – that our healthcare system has been nearly perfectly designed to generate chaotic behaviour.  That may not have been the intention but it is the outcome.

So how did we get ourselves into this mess … and how do we get ourselves out of it?


To understand chaotic flow behaviour we need to consider two effects: the first is called a destabilising effect, the other is a stabilising effect.

The golden rule of chaos is that if the destabilising effect dominates then we get bumpy behaviour, if the stabilizing effect dominates then we get smooth flow.

So to eliminate the chaos all we need to do is to adjust the balance of these two effects … increase the stabilisers and reduce the destabilisers.

And because of the counter-intuitive nature of non-linear flow systems, only a small change in this balance can have a big effect: it can flip us from stable to chaotic, and it can also flip us back.

The trick is knowing how to tweak the design to create the flip.  Tweak at the wrong place or wrong time and nothing improves … as our chart above illustrates.

We need chaotic-flow-diagnostic and anti-chaotic-flow-design capability … and that is clearly lacking … because if it were present we would not be having this conversation.


And that capability exists … it is called Improvement Science. We just need to learn it.

Guess-work or Grunt-work?

back_and_forth_questions_150_wht_8159Improvement flows from change. Change flows from action. Action flows from decision.

And we can make a decision in one of two ways – we can use guess-work or we can use grunt-work.

Of course it does not feel as black and white as that so let us put those two options at the opposite ends of a spectrum. Pure guess-work at one and and pure grunt-work at the other.

Guess-work is the easier end. To guess we just need a random number generator of some sort – like a dice.  Grunt-work is the harder end.  And what exactly is “grunt-work”?


Using available knowledge to work out a decision that will get us to our intended  outcome is grunt-work.  It does not require creativity, imagination, assumptions, beliefs, judgements and all the usual machinery that we humans employ to make decisions. It just requires following the tried-and-tested recipe and doing the grunt-work. A computer does grunt-work. It just follows the recipe we give it.

But experience shows that we even with hard work we do not always get the outcome we intend. So what is going wrong?

When the required knowledge is available and we do not use it we are exhibiting ineptitude. So in that context then we have a clear path of improvement: We invest first in dissolving our own ineptitude. We invest in learning what is already known.  And that is grunt-work. Hard work.

When the required knowledge is not available then we are exhibiting ignorance.  And our ignorance is exposed in two ways: firstly when we cannot make a decision of what to do because we have no option other than to guess. And secondly when what we predicted would happen as a result of our action did not actually happen. Reality disproved our rhetoric.

When we are ignorant we have a different path of improvement – first we need to do research to improve our knowledge and understanding, and only then when we are able to apply the new knowledge to make reliable predictions. We need tested and trusted knowledge to design a path to out intended outcome.

And as Richard Feynman perceptively observed … research starts with an educated guess.  We might call it an hypothesis but it is a guess nevertheless. From that we make predictions and then we do experiments using reality to test our rhetoric. All guesses that fail the reality-check are rejected. So our vast body of scientific knowledge is the accumulation of guesses that did not fail the reality-check.

The critical word in the paragraph above is “educated”. How do researchers make educated guesses?

What does the word “educated” imply?


School is all about learning what is already “known”.  There is no debate.  The teachers are always right, only the students can be wrong. It is assumed.

But most of our learning comes from what we experience before and after school.  We are all enrolled in the University of Life – and the teacher there is reality, not rhetoric.

And when we are tested by reality we are very often found to be lacking something.  Well actually we are always found to be lacking.  Sometimes we flunk the test outright and have to go back to the bottom of the learning ladder. Sometimes we scrape a bare pass … we survive … but we know we came close to failing.  Sometimes we secure a safe pass … and still we know we could have done better.  We can always do better.

But how?  Is it because we were ignorant?  Or was it because we were inept?

Examinations at The University of Rhetoric are designed to measure our ineptitude.

The University of Life is not so didactic or autocratic.  The challenges it presents come from anywhere in the Ignorance-Ineptitude Zone.  We need educated guesswork to survive there.


So one problem we face is how do we differentiate ignorance from ineptitude?

At this point it is important to separate individual ignorance from collective ignorance; and individual ineptitude from collective ineptitude. There are two dimensions at play.

The history of science is characterised by individuals who first resolved their individual ignorance when they discover something new. Only later was it appreciated that they were the first. So long as that discovery is shared then collective ignorance has reduced too. There is no need for everyone to rediscover everything when we share our learning.

Newton’s “discovery” of the Laws of Motion is a good example of an individual discovery quickly becoming collective knowledge. And with that collective knowledge we have proved we are able to land a spaceship on a far distant comet! That is grunt-work.

Einstein’s “discovery” of Relativity did not disprove Newton’s Laws of Motion, it re-framed and re-fined them so that even more profound predictions could be made. Some of the predictions are only now being tested as our technology has evolved to be able to perform the measurements with sufficient precision and accuracy. That is grunt-work.  And it is increasingly collective grunt-work.


We are all born individually ignorant and individually inept.

Through experience and education we become aware of collective knowledge and with that we develop our individual capabilities. We do not re-invent every wheel.

And with that individual capability we are able to survive. We can secure a “pass” in the University of Life Survival Challenge.

But it leaves a lot of room for improvement.

Continuing to build collective knowledge through scientific research into more and more complicated and complex challenges, such as climate change, is necessary. But it is not sufficient. We need more.

Developing  our collective capability to put that knowledge to the service of every living thing on the Earth is our challenge.  And that is not grunt-work because we do not have a recipe to follow. We have to discover how to do that.

And that journey of discovery is called Improvement Science.


People first or Process first?

stick_figure_balance_mind_heart_150_wht_9344A recurring theme this week has been the interplay between the cultural and the technical dimensions of system improvement.

The hearts and the minds.  The people and the process.  The psychology and the physics.

Reflecting on the many conversations what became clear was that both are required but not always in the same amount and in the same sequence.

The context is critical.

In some cases we can start with some technical stuff. Some flow physics and a Gantt and Run chart or two.

In other cases we have to start with some cultural stuff. Some conversations about values, beliefs and behaviours.

And they are both tricky but in different ways.


The technical stuff is counter-intuitive.  We have to engage our logical, rational thinking brains and work it through step-by-step, making every assumption explicit and every definition clear.

If we go with our gut we get it wrong (although we feel it is right) and then we fail, and then we blame others or ourselves. Either way we lose confidence.  The logical thinking is hard work. It makes our heads ache. So we cut corners.

But once we have understood then it gets much easier because we can then translate our hard won understanding into a trusted heuristic.  We do not need to work it out every time. We can just look up the correct recipe.

And there lurks a trap … the problem that was at first unrecognised, then impossible, then difficult, and then doable … becomes easy and even obvious … but only after we have worked out a solution. And that obvious-in-hindsight effect is a source of many dangers …

… we can become complacent, over-confident, and even dismissive of others who have not been through the ‘pain’ of learning. We may be tempted to elevate our status and to inflate our importance by hoarding our hard-won understanding. We risk losing our humility … and when we do that we stop being curious and we stop learning. And then we are part of the problem again.

So to avoid those traps we need to hold ourselves in the role of the teacher and coach. We need to actively share what we have learned and explain how we came to know it.  One step at a time … the blood, the sweat and the tears … the confusion and eureka moments. Not one giant leap from where we started to where we got to.  And when we have the generosity to share our knowledge … it is surprising how much we learn!  We learn more from teaching than by being taught.


The cultural stuff is counter-intuitive too.  We have to engage our emotional, irrational, feeling brains and step back from the objective fine-print to look at the subjective full-picture. We have to become curious. We have to look at the problem from as many perspectives as we can. We have to practice humble inquiry by asking others what they see.

If we go with our gut  and rely only on our learned and habitual beliefs, our untested assumptions and our prejudices … we get it wrong. When we filter reality to match our rhetoric, we leap to invalid conclusions, and we make unwise decisions, and they lead to counter-productive actions.

Our language and behaviour gives the game away … we cannot help it … because all this is happening unconsciously and out of our awareness.

So we need to solicit unfiltered feedback from trusted others who will describe what they see.  And that is tough to do.


So how do we know where to act first? Cultural or technical?

The conclusion I have come to is to use a check-list … the Safe System Improvement check-list so to speak.

Check cultural first – Is there a need to do some people stuff? If so then do it.

Check technical second – Is there a need to do some process stuff? If so then do it.

If neither are needed then we need to get out of the way and let the people redesign the processes. Only they can.

Metamorphosis

butterfly_flying_around_465Some animals undergo a remarkable transformation on their journey to becoming an adult.

This metamorphosis is most obvious with a butterfly: the caterpillar enters the stage and a butterfly emerges.

The capabilities and behaviours of these development stages are very different.  A baby caterpillar crawls and feeds on leaves;  an adult butterfly flies and feeds on nectar.


There are many similarities to the transformation of an organisation from chaotic to calm; from depressed to enthused; and from struggling to flying.

It is the metamorphosis of individuals within organisations that drives the system change – the transformation from inept sceptics to capable advocates.


metamorphosis_1The journey starts with the tiny, hungry, baby caterpillar emerging from the egg.

This like a curious new sceptic emerging from denial and tentatively engaging the the process of learning. Usually triggered by seeing or hearing of a significant and sustained success that disproves their ‘impossibility hypothesis’.


metamorphosis_2A caterpillar is an eating machine. As it grows it sheds its skin and becomes larger. It also changes its appearance and eventually its behaviour.

Our curious improvement sceptic is devouring new information and is visibly growing in knowledge, understanding and confidence. 


metamorphosis_3When the caterpillar sheds the last skin a new form emerges. A pupa. It has a different appearance and behaviour. It is now stationary and it does not move or eat.

This is the contemplative sceptic who appears to have become dormant but is not … they are planning to change. This stage is very variable: it may be minutes or years.


metamorphosis_5Inside the pupa the solid body of the caterpillar is converted to ‘cellular soup’ and the cells are reassembled into a completely new structure called an adult butterfly.

Our healthy sceptic is dissolving their self-limiting beliefs and restructuring their mental model. It is stage of apparent confusion and success is not guaranteed.


metamorphosis_7And suddenly the adult butterfly emerges: fully formed but not yet able to fly. Its wings are not yet ready – they need to be inflated, to dry and be flexed.

So it is with our newly hatched improvement practitioner. They need to pause, prepare, and practice before they feel safe to fly solo.  They start small but are thinking big.


metamorphosis_8After a short rest the new wings are fully expanded and able to lift the butterfly aloft to explore the new opportunities that await. A whole new and exciting world full of flowers and nectar.

Our improvement practitioner can also feel when they are ready to explore. And then they fly – right first time.


An active improvement practitioner will inspire others to emerge, and many of those will hatch into improvement caterpillars who will busily munch on the new knowledge and grow in understanding and confidence. Then it goes quiet and, as if by magic, a new generation of improvement butterflies appear. And they continue to spread the word and the knowledge.

That is how Improvement Science grows and spreads – by metamorphosis.

A Little Law and Order

teamwork_puzzle_build_PA_150_wht_2341[Bing bong]. The sound heralded Lesley logging on to the weekly Webex coaching session with Bob, an experienced Improvement Science Practitioner.

<Bob> Good afternoon Lesley.  How has your week been and what topic shall we explore today?

<Lesley> Hi Bob. Well in a nutshell, the bit of the system that I have control over feels like a fragile oasis of calm in a perpetual desert of chaos.  It is hard work keeping the oasis clear of the toxic sand that blows in!

<Bob> A compelling metaphor. I can just picture it.  Maintaining order amidst chaos requires energy. So what would you like to talk about?

<Lesley> Well, I have a small shoal of FISHees who I am guiding  through the foundation shallows and they are getting stuck on Little’s Law.  I confess I am not very good at explaining it and that suggests to me that I do not really understand it well enough either.

<Bob> OK. So shall we link those two theme – chaos and Little’s Law?

<Lesley> That sounds like an excellent plan!

<Bob> OK. So let us refresh the foundation knowledge. What is Little’s Law?

<Lesley>It is a fundamental Law of process physics that relates flow, with lead time and work in progress.

<Bob> Good. And specifically?

<Lesley> Average lead time is equal to the average flow multiplied by the average work in progress.

<Bob>Yes. And what are the units of flow in your equation?

<Lesley> Ah yes! That is  a trap for the unwary. We need to be clear how we express flow. The usual way is to state it as number of tasks in a defined period of time, such as patients admitted per day.  In Little’s Law the convention is to use the inverse of that which is the average interval between consecutive flow events. This is an unfamiliar way to present flow to most people.

<Bob> Good. And what is the reason that we use the ‘interval between events’ form?

<Leslie> Because it is easier to compare it with two critically important  flow metrics … the takt time and the cycle time.

<Bob> And what is the takt time?

<Leslie> It is the average interval between new tasks arriving … the average demand interval.

<Bob> And the cycle time?

<Leslie> It is the shortest average interval between tasks departing …. and is determined by the design of the flow constraint step.

<Bob> Excellent. And what is the essence of a stable flow design?

<Lesley> That the cycle time is less than the takt time.

<Bob>Why less than? Why not equal to?

<Leslie> Because all realistic systems need some flow resilience to exhibit stable and predictable-within-limits behaviour.

<Bob> Excellent. Now describe the design requirements for creating chronically chaotic system behaviour?

<Leslie> This is a bit trickier to explain. The essence is that for chronically chaotic behaviour to happen then there must be two feedback loops – a destabilising loop and a stabilising loop.  The destabilising loop creates the chaos, the stabilising loop ensures it is chronic.

<Bob> Good … so can you give me an example of a destabilising feedback loop?

<Leslie> A common one that I see is when there is a long delay between detecting a safety risk and the diagnosis, decision and corrective action.  The risks are often transitory so if the corrective action arrives long after the root cause has gone away then it can actually destabilise the process and paradoxically increase the risk of harm.

<Bob> Can you give me an example?

<Leslie>Yes. Suppose a safety risk is exposed by a near miss.  A delay in communicating the niggle and a root cause analysis means that the specific combination of factors that led to the near miss has gone. The holes in the Swiss cheese are not static … they move about in the chaos.  So the action that follows the accumulation of many undiagnosed near misses is usually the non-specific mantra of adding yet another safety-check to the already burgeoning check-list. The longer check-list takes more time to do, and is often repeated many times, so the whole flow slows down, queues grow bigger, waiting times get longer and as pressure comes from the delivery targets corners start being cut, and new near misses start to occur; on top of the other ones. So more checks are added and so on.

<Bob> An excellent example! And what is the outcome?

<Leslie> Chronic chaos which is more dangerous, more disordered and more expensive. Lose lose lose.

<Bob> And how do the people feel who work in the system?

<Leslie> Chronically naffed off! Angry. Demotivated. Cynical.

<Bob>And those feelings are the key symptoms.  Niggles are not only symptoms of poor process design, they are also symptoms of a much deeper problem: a violation of values.

<Leslie> I get the first bit about poor design; but what is that second bit about values?

<Bob>  We all have a set of values that we learned when we were very young and that have bee shaped by life experience.  They are our source of emotional energy, and our guiding lights in an uncertain world. Our internal unconscious check-list.  So when one of our values is violated we know because we feel angry. How that anger is directed varies from person to person … some internalise it and some externalise it.

<Leslie> OK. That explains the commonest emotion that people report when they feel a niggle … frustration which is the same as anger.

<Bob>Yes.  And we reveal our values by uncovering the specific root causes of our niggles.  For example if I value ‘Hard Work’ then I will be niggled by laziness. If you value ‘Experimentation’ then you may be niggled by ‘Rigid Rules’.  If someone else values ‘Safety’ then they may value ‘Rigid Rules’ and be niggled by ‘Innovation’ which they interpret as risky.

<Leslie> Ahhhh! Yes, I see.  This explains why there is so much impassioned discussion when we do a 4N Chart! But if this behaviour is so innate then it must be impossible to resolve!

<Bob> Understanding  how our values motivate us actually helps a lot because we are naturally attracted to others who share the same values – because we have learned that it reduces conflict and stress and improves our chance of survival. We are tribal and tribes share the same values.

<Leslie> Is that why different  departments appear to have different cultures and behaviours and why they fight each other?

<Bob> It is one factor in the Silo Wars that are a characteristic of some large organisations.  But Silo Wars are not inevitable.

<Leslie> So how are they avoided?

<Bob> By everyone knowing what common purpose of the organisation is and by being clear about what values are aligned with that purpose.

<Leslie> So in the healthcare context one purpose is avoidance of harm … primum non nocere … so ‘safety’ is a core value.  Which implies anything that is felt to be unsafe generates niggles and well-intended but potentially self-destructive negative behaviour.

<Bob> Indeed so, as you described very well.

<Leslie> So how does all this link to Little’s Law?

<Bob>Let us go back to the foundation knowledge. What are the four interdependent dimensions of system improvement?

<Leslie> Safety, Flow, Quality and Productivity.

<Bob> And one measure of  productivity is profit.  So organisations that have only short term profit as their primary goal are at risk of making poor long term safety, flow and quality decisions.

<Leslie> And flow is the key dimension – because profit is just  the difference between two cash flows: income and expenses.

<Bob> Exactly. One way or another it all comes down to flow … and Little’s Law is a fundamental Law of flow physics. So if you want all the other outcomes … without the emotionally painful disorder and chaos … then you cannot avoid learning to use Little’s Law.

<Leslie> Wow!  That is a profound insight.  I will need to lie down in a darkened room and meditate on that!

<Bob> An oasis of calm is the perfect place to pause, rest and reflect.

Feel the Fear

monster_in_closet_150_wht_14500We spend a lot of time in a state of anxiety and fear. It is part and parcel of life because there are many real threats that we need to detect and avoid.

For our own safety and survival.

Unfortunately there are also many imagined threats that feel just as real and just as terrifying.

In these cases it is our fear that does the damage because it paralyses our decision making and triggers our ‘fright’ then ‘fight’ or ‘flight’ reaction.

Fear is not bad … the emotional energy it releases can be channelled into change and improvement. Just as anger can.


So we need to be able to distinguish the real fears from the imaginary ones. And we need effective strategies to defuse the imaginary ones.  Because until we do that we will find it very difficult to listen, learn, experiment, change and improve.

So let us grasp the nettle and talk about a dozen universal fears …

Fear of dying before one’s time.
Fear of having one’s basic identity questioned.
Fear of poverty or loss of one’s livelihood.
Fear of being denied one’s fundamental rights and liberties.

Fear of being unjustly accused of wrongdoing.
Fear of public humiliation.
Fear of being unjustly seen as lacking character.
Fear of being discovered as inauthentic – a fraud.

Fear of radical change.
Fear of feedback.
Fear of failure.
Fear of the unknown.

Notice that some of these fears are much ‘deeper’ than others … this list is approximately in depth order. Some relate to ‘self’; some relate to ‘others’ and all are inter-related to some degree. Fear of failure links to fear of humiliation and to fear of loss-of-livelihood.


Of these the four that are closest to the surface are the easiest to tackle … fear of radical change, fear of feedback, fear of failure, and fear of the unknown.  These are the Four Fears that block personal improvement.


Fear of the unknown is the easiest to defuse. We just open the door and look … from an emotionally safe distance so that we can run away if our worst fears are realised … which does not happen when the fear is imagined.

This is an effective strategy for defusing the emotionally and socially damaging effects of self-generated phobias.

And we find overcoming fear-of-the-unknown exhilarating … that is how theme parks and roller-coaster rides work.

First we open our eyes, we look, we see, we observe, we reflect, we learn and we convert the unknown to the unfamiliar and then to the familiar. We may not conquer our fear completely … there may be some reasonable residual anxiety … but we have learned to contain it and to control it. We have made friends with our inner Chimp. We climb aboard the roller coaster that is called ‘life’.


Fear of failure is next.  We defuse this by learning how to fail safely so that we can learn-by-doing and by that means we reduce the risk of future failures. We make frequent small safe failures in order to learn how to avoid the rare big unsafe ones!

Many people approach improvement from an academic angle. They sit on the fence. They are the reflector-theorists. And this may because they are too fearful-of-failing to learn the how-by-doing. So they are unable to demonstrate the how and their fear becomes the fear-of-fraud and the fear-of-humiliation. They are blocked from developing their pragmatist/activist capability by their self-generated fear-of-failure.

So we start small, we stay focussed, we stay inside our circle of control, and we create a safe zone where we can learn how to fail safely – first in private and later in public.

One of the most inspiring behaviours of an effective leader is the courage to learn in public and to make small failures that demonstrate their humility and humanity.

Those who insist on ‘perfect’ leaders are guaranteed to be disappointed.


And one thing that we all fail repeatedly is to ask for, to give and to receive effective feedback. This links to the deeper fear-of-humiliation.

And it is relatively easy to defuse this fear-of-feedback too … we just need a framework to support us until we find our feet and our confidence.

The key to effective feedback is to make it non-judgemental.

And that can only be done by developing our ability to step back and out of the Drama Triangle and to cultivate an I’m OK- You’re OK  mindset.

The mindset of mutual respect. Self-respect and Other-respect.

And remember that Other-respect does not imply trust, alignment, agreement, or even liking.

Sworn enemies can respect each other while at the same time not trusting, liking or agreeing with each other.

Judgement-free feedback (JFF) is a very effective technique … both for defusing fear and for developing mutual respect.

And from that foundation radical change becomes possible, even inevitable.

Wacky Language

wacky_languageAll innovative ideas are inevitably associated with new language.

Familiar words used in an unfamiliar context so that the language sounds ‘wacky’ to those in the current paradigm.

Improvement science is no different.

A problem arises when familiar words are used in a new context and therefore with a different meaning. Confusion.

So we try to avoid this cognitive confusion by inventing new words, or by using foreign words that are ‘correct’ but unfamiliar.

This use of novel and foreign language exposes us to another danger: the evolution of a clique of self-appointed experts who speak the new and ‘wacky’ language.

This self-appointed expert clique can actually hinder change because it can result yet another us-and-them division.  Another tribe. More discussion. More confusion. Less improvement.


So it is important for an effective facilitator-of-improvement to define any new language using the language of the current paradigm.  This can be achieved by sharing examples of new concepts and their language in familiar contexts and with familiar words, because we learn what words mean from their use-in-context.

For example:

The word ‘capacity’ is familiar and we all know what we think it means.  So when we link it to another familiar word, ‘demand’, then we feel comfortable that we understand what the phrase ‘demand-and-capacity’ means.

But do we?

The act of recognising a word is a use of memory or knowledge. Understanding what a word means requires more … it requires knowing the context in which the word is used.  It means understanding the concept that the word is a label for.

To a practitioner of flow science the word ‘capacity’ is confusing – because it is too fuzzy.  There are many different forms of capacity: flow-capacity, space-capacity, time-capacity, and so on.  Each has a different unit and they are not interchangeable. So the unqualified term ‘capacity’ will trigger the question:

What sort of capacity are you referring to?

[And if that is not the reaction then you may be talking to someone who has little understanding of flow science].


Then there are the foreign words that are used as new labels for old concepts.

Lean zealots seem particularly fond of peppering their monologues with Japanese words that are meaningless to anyone else but other Lean zealots.  Words like muda and muri and mura which are labels for important and useful flow science concepts … but the foreign name gives no clue as to what that essential concept is!

[And for a bit of harmless sport ask a Lean zealot to explain what these three words actually mean but only using  language that you understand. If they cannot to your satisfaction then you have exposed the niggle. And if they can then it is worth asking ‘What is the added value of the foreign language?’]

And for those who are curious to know the essential concepts that these four-letter M words refer to:

muda means ‘waste’ and refers to the effects of poor process design in terms of the extra time (and cost) required for the process to achieve its intended purpose.  A linked concept is a ‘niggle’ which is the negative emotional effect of a poor process design.

muri means ‘overburdening’ and can be illustrated  with an example.  Suppose you work in a system where there is always a big backlog of work waiting to be done … a large queue of patients in the waiting room … a big heap of notes on the trolley. That ‘burden’ generates stress and leads to other risky behaviours such as rushing, corner-cutting, deflection and overspill. It is also an outcome of poor process design, so  is avoidable.

mura means variation or uncertainty. Again an example helps. Suppose we are running an emergency service then, by definition, a we have no idea what medical problem the next patient that comes through the door will present us with. It could be trivial or life-threatening. That is unplanned and expected variation and is part of the what we need our service to be designed to handle.  Suppose when we arrive for our shift that we have no idea how many staff will be available to do the work because people phone in sick at the last minute and there is no resilience on the staffing capacity.  Our day could be calm-and-capable (and rewarding) or chaotic-and-incapable (and unrewarding).  It is the stress of not knowing that creates the emotional and cultural damage, and is the expected outcome of incompetent process design. And is avoidable.


And finally we come to words that are not foreign but are not very familiar either.

Words like praxis.

This sounds like ‘practice’ but is not spelt the same. So is the the same?

And it sounds like a medical condition called dyspraxia which means:  poor coordination of movement.

And when we look up praxis in an English dictionary we discover that one definition is:

the practice and practical side of a profession or field of study, as opposed to theory.

Ah ah! So praxis is a label for the the concept of ‘how to’ … and someone who has this ‘know how’ is called a practitioner.  That makes sense.

On deeper reflection we might then describe our poor collective process design capability as dyspraxic or uncoordinated. That feels about right too.


An improvement science practitioner (ISP) is someone who knows the science of improvement; and can demonstrate their know-how in practice; and can explain the principles that underpin their praxis using the language of the learner. Without any wacky language.

So if we want to diagnose and treat our organisational dyspraxia;

… and if we want smooth and efficient services (i.e. elimination of chaos and reduction of cost);

… and if we want to learn this know-how,  practice or praxis;

… then we could study the Foundations of Improvement Science in Healthcare (FISH);

… and we could seek the wisdom of  the growing Community of Healthcare Improvement Practitioners (CHIPs).


FISH & CHIPs … a new use for a familiar phrase?

Actions Speak

media_video_icon_anim_150_wht_14142In a recent blog we explored the subject of learning styles and how a balance of complementary learning styles is needed to get the wheel-of-change turning.

Experience shows that many of us show a relative weakness in the ‘Activist’ quadrant of the cycle.

That implies we are less comfortable with learning-by-doing. Experimenting.

This behaviour is driven by a learned fear.  The fear-of-failure.

So when did we learn this fear?

Typically it is learned during childhood and is reinforced throughout adulthood.

The fear comes not from the failure though  … it comes from the emotional reaction of others to our supposed failure. The emotional backlash of significant others. Parents and parent-like figures such as school teachers.

Children are naturally curious and experimental and fearless.  That is how they learn. They make lots of mistakes – but they learn from them. Walking, talking, tying a shoelace, and so on.  Small mistakes do not created fear. We learn fear from others.

Full-of-fear others.

To an adult who has learned how to do many things it becomes easy to be impatient with the trial-and-error approach of a child … and typically we react in three ways:

1) We say “Don’t do that” when we see our child attempt something in a way we believe will not work or we believe could cause an accident. We teach them our fears.

2) We say “No” when we disagree with an idea or an answer that a child has offered. We discount them by discounting their ideas.

3) We say “I’ll do it” when we see a child try and fail. We discount their ability to learn how to solve problems and we discount our ability to let them.

Our emotional reaction is negative in all three cases and that is what teaches our child the fear of failure.

So they stop trying as hard.

And bit-by-bit they lose their curiosity and their courage.

We have now put them on the path to scepticism and cynicism.  Which is how we were taught.


This fear-of-failure brainwashing continues at school.

But now it is more than just fear of disappointing our parents; now it is fear of failing tests and exams … fear of the negative emotional backlash from peers, teachers and parents.

Some give up: they flee.  Others become competitive: they fight.

Neither strategies dissolve the source of the fear though … they just exacerbate it.


So it is rather too common to see very accomplished people paralysed with fear when circumstances dictate that they need to change in some way … to learn a new skill for example … to self-improve maybe.

Their deeply ingrained fear-of-failure surfaces and takes over control – and the fright/flight/fight behaviour is manifest.


So to get to the elusive win-win-win outcomes we want we have to weaken the fear-of-failure reflex … we need to develop a new habit … learning-by-doing.

The trick to this is to focus on things that fall 100% inside our circle of control … the Niggles that rank highest on our Niggle-o-Gram®.

And when we Study the top niggle; and then Plan the change; and then Do what we planned, and then Study effect of our action … then we learn-by-doing.

But not just by doing …. by Studying, Planning, Doing and Studying again.

Actions Speak not just to us but to everyone else too.

The 85% Optimum Occupancy Myth

egg_face_spooked_400_wht_13421There seems to be a belief among some people that the “optimum” average bed occupancy for a hospital is around 85%.

More than that risks running out of beds and admissions being blocked, 4 hour breaches appearing and patients being put at risk. Less than that is inefficient use of expensive resources. They claim there is a ‘magic sweet spot’ that we should aim for.

Unfortunately, this 85% optimum occupancy belief is a myth.

So, first we need to dispel it, then we need to understand where it came from, and then we are ready to learn how to actually prevent queues, delays, disappointment, avoidable harm and financial non-viability.


Disproving this myth is surprisingly easy.   A simple thought experiment is enough.

Suppose we have a policy where  we keep patients in hospital until someone needs their bed, then we discharge the patient with the longest length of stay and admit the new one into the still warm bed – like a baton pass.  There would be no patients turned away – 0% breaches.  And all our the beds would always be full – 100% occupancy. Perfection!

And it does not matter if the number of admissions arriving per day is varying – as it will.

And it does not matter if the length of stay is varying from patient to patient – as it will.

We have disproved the hypothesis that a maximum 85% average occupancy is required to achieve 0% breaches.


The source of this specific myth appears to be a paper published in the British Medical Journal in 1999 called “Dynamics of bed use in accommodating emergency admissions: stochastic simulation model

So it appears that this myth was cooked up by academic health economists using a computer model.

And then amateur queue theory zealots jump on the band-wagon to defend this meaningless mantra and create a smoke-screen by bamboozling the mathematical muggles with tales of Poisson processes and Erlang equations.

And they are sort-of correct … the theoretical behaviour of the “ideal” stochastic demand process was described by Poisson and the equations that describe the theoretical behaviour were described by Agner Krarup Erlang.  Over 100 years ago before we had computers.

BUT …

The academics and amateurs conveniently omit one minor, but annoying,  fact … that real world systems have people in them … and people are irrational … and people cook up policies that ride roughshod over the mathematics, the statistics and the simplistic, stochastic mathematical and computer models.

And when creative people start meddling then just about anything can happen!


So what went wrong here?

One problem is that the academic hefalumps unwittingly stumbled into a whole minefield of pragmatic process design traps.

Here are just some of them …

1. Occupancy is a ratio – it is a meaningless number without its context – the flow parameters.

2. Using linear, stochastic models is dangerous – they ignore the non-linear complex system behaviours (chaos to you and me).

3. Occupancy relates to space-capacity and says nothing about the flow-capacity or the space-capacity and flow-capacity scheduling.

4. Space-capacity utilisation (i.e. occupancy) and systemic operational efficiency are not equivalent.

5. Queue theory is a simplification of reality that is needed to make the mathematics manageable.

6. Ignoring the fact that our real systems are both complex and adaptive implies that blind application of basic queue theory rhetoric is dangerous.

And if we recognise and avoid these traps and we re-examine the problem a little more pragmatically then we discover something very  useful:

That the maximum space capacity requirement (the number of beds needed to avoid breaches) is actually easily predictable.

It does not need a black-magic-box full of scary queue theory equations or rather complicated stochastic simulation models to do this … all we need is our tried-and-trusted tool … a spreadsheet.

And we need something else … some flow science training and some simulation model design discipline.

When we do that we discover something else …. that the expected average occupancy is not 85%  … or 65%, or 99%, or 95%.

There is no one-size-fits-all optimum occupancy number.

And as we explore further we discover that:

The expected average occupancy is context dependent.

And when we remember that our real system is adaptive, and it is staffed with well-intended, well-educated, creative people (who may have become rather addicted to reactive fire-fighting),  then we begin to see why the behaviour of real systems seems to defy the predictions of the 85% optimum occupancy myth:

Our hospitals seem to work better-than-predicted at much higher occupancy rates.

And then we realise that we might actually be able to design proactive policies that are better able to manage unpredictable variation; better than the simplistic maximum 85% average occupancy mantra.

And finally another penny drops … average occupancy is an output of the system …. not an input. It is an effect.

And so is average length of stay.

Which implies that setting these output effects as causal inputs to our bed model creates a meaningless, self-fulfilling, self-justifying delusion.

Ooops!


Now our challenge is clear … we need to learn proactive and adaptive flow policy design … and using that understanding we have the potential to deliver zero delays and high productivity at the same time.

And doing that requires a bit more than a spreadsheet … but it is possible.

Purpose-Process-Pilot-Policy-Police

inspector_searching_around_150_wht_14757When it comes to light that things are not going well a common reaction from the top is to send in more inspectors.

This may give the impression that something decisive is being done but it almost never works … for two reasons.

The first is because it is attempting to treat the symptom and not the cause.

The second is because the inspectors are created in the same paradigm that that created the problem.

That is not so say that inspectors are not required … they are … when the system is working … not when it is failing.

The inspection police actually come last – and just before them comes the Policy that the Police enforce.

Policy comes next to last. Not first.

A rational Policy can only be written once there is proof of  effectiveness … and that requires a Pilot study … in the real world.

A small scale reality check of the rhetoric.

Cooking up Policy and delivery plans based on untested rhetoric from the current paradigm is a recipe for disappointment.


Working backwards we can see that the Pilot needs something to pilot … and that is a new Process; to replace the old process that is failing to deliver.

And any Process needs to be designed to be fit-for-purpose.  Cutting-and-pasting someone else’s design usually does not work. The design process is more important than the design it creates.

So thus brings us to the first essential requirement … the Purpose.

And that is where we very often find a big gap … an error of omission … no clarity or constancy of common Purpose.

And that is where leaders must start. It is their job to clarify and communicate the common Purpose. And if the leaders are not cohesive and the board cannot agree the Purpose then the political cracks will spread through the whole organisation and destabilize it.

And with a Purpose the system and process designers can get to work.

But here we hit another gap. There is virtually no design capability in most organisations.

There is usually lots of delivery capability … but efficiently delivering an ineffective design will amplify the chaos not dissolve it.

So in parallel with clarifying the purpose, the leaders must  endorse the creation of a cohort of process designers.

And from the organisation a cohort of process inspectors … but of a different calibre … inspectors who are able to find the root causes and able to guide the improvement process because they have done this themselves many times before.

And perhaps to draw a line between the future and the past we could give them a different name – Mentors.

Economy-of-Scale vs Economy-of-Flow

We_Need_Small_HospitalsThis was an interesting headline to see on the front page of a newspaper yesterday!

The Top Man of the NHS is openly challenging the current Centralisation-is-The-Only-Way-Forward Mantra;  and for good reason.

Mass centralisation is poor system design – very poor.

Q: So what is driving the centralisation agenda?

A: Money.

Or to be more precise – rather simplistic thinking about money.

The misguided money logic goes like this:

1. Resources (such as highly trained doctors, nurses and AHPs) cost a lot of money to provide.
[Yes].

2. So we want all these resources to be fully-utilised to get value-for-money.
[No, not all – just the most expensive].

3. So we will gather all the most expensive resources into one place to get the Economy-of-Scale.
[No, not all the most expensive – just the most specialised]

4. And we will suck /push all the work through these super-hubs to keep our expensive specialist resources busy all the time.
[No, what about the growing population of older folks who just need a bit of expert healthcare support, quickly, and close to home?]

This flawed logic confuses two complementary ways to achieve higher system productivity/economy/value-for-money without  sacrificing safety:

Economies of Scale (EoS) and Economies of Flow (EoF).

Of the two the EoF is the more important because by using EoF principles we can increase productivity in huge leaps at almost no cost; and without causing harm and disappointment. EoS are always destructive.

But that is impossible. You are talking rubbish … because if it were possible we would be doing it!

It is not impossible and we are doing it … but not at scale and pace in healthcare … and the reason for that is we are not trained in Economy-of-Flow methods.

And those who are trained and who have have experienced the effects of EoF would not do it any other way.

Example:

In a recent EoF exercise an ISP (Improvement Science Practitioner) helped a surgical team to increase their operating theatre productivity by 30% overnight at no cost.  The productivity improvement was measured and sustained for most of the last year. [it did dip a bit when the waiting list evaporated because of the higher throughput, and again after some meddlesome middle management madness was triggered by end-of-financial-year target chasing].  The team achieved the improvement using Economy of Flow principles and by re-designing some historical scheduling policies. The new policies  were less antagonistic. They were designed to line the ducks up and as a result the flow improved.


So the specific issue of  Super Hospitals vs Small Hospitals is actually an Economy of Flow design challenge.

But there is another critical factor to take into account.

Specialisation.

Medicine has become super-specialised for a simple reason: it is believed that to get ‘good enough’ at something you have to have a lot of practice. And to get the practice you have to have high volumes of the same stuff – so you need to specialise and then to sort undifferentiated work into separate ‘speciologist’ streams or sequence the work through separate speciologist stages.

Generalists are relegated to second-class-citizen status; mere tripe-skimmers and sign-posters.

Specialisation is certainly one way to get ‘good enough’ at doing something … but it is not the only way.

Another way to learn the key-essentials from someone who already knows (and can teach) and then to continuously improve using feedback on what works and what does not – feedback from everywhere.

This second approach is actually a much more effective and efficient way to develop expertise – but we have not been taught this way.  We have only learned the scrape-the-burned-toast-by-suck-and-see method.

We need to experience another way.

We need to experience rapid acquisition of expertise!

And being able to gain expertise quickly means that we can become expert generalists.

There is good evidence that the broader our skill-set the more resilient we are to change, and the more innovative we are when faced with novel challenges.

In the Navy of the 1800’s sailors were “Jacks of All Trades and Master of One” because if only one person knew how to navigate and they got shot or died of scurvy the whole ship was doomed.  Survival required resilience and that meant multi-skilled teams who were good enough at everything to keep the ship afloat – literally.


Specialisation has another big drawback – it is very expensive and on many dimensions. Not just Finance.

Example:

Suppose we have six-step process and we have specialised to the point where an individual can only do one step to the required level of performance (safety/flow/quality/productivity).  The minimum number of people we need is six and the process only flows when we have all six people. Our minimum costs are high and they do not scale with flow.

If any one of the six are not there then the whole process stops. There is no flow.  So queues build up and smooth flow is sacrificed.

Out system behaves in an unstable and chaotic feast-or-famine manner and rapidly shifting priorities create what is technically called ‘thrashing’.

And the special-six do not like the constant battering.

And the special-six have the power to individually hold the whole system to ransom – they do not even need to agree.

And then we aggravate the problem by paying them the high salary that it is independent of how much they collectively achieve.

We now have the perfect recipe for a bigger problem!  A bunch of grumpy, highly-paid specialists who blame each other for the chaos and who incessantly clamour for ‘more resources’ at every step.

This is not financially viable and so creates the drive for economy-of-scale thinking in which to get us ‘flow resilience’ we need more than one specialist at each of the six steps so that if one is on holiday or off sick then the process can still flow.  Let us call these tribes of ‘speciologists’ there own names and budgets, and now we need to put all these departments somewhere – so we will need a big hospital to fit them in – along with the queues of waiting work that they need.

Now we make an even bigger design blunder.  We assume the ‘efficiency’ of our system is the same as the average utilisation of all the departments – so we trim budgets until everyone’s utilisation is high; and we suck any-old work in to ensure there is always something to do to keep everyone busy.

And in so doing we sacrifice all our Economy of Flow opportunities and we then scratch our heads and wonder why our total costs and queues are escalating,  safety and quality are falling, the chaos continues, and our tribes of highly-paid specialists are as grumpy as ever they were!   It must be an impossible-to-solve problem!


Now contrast that with having a pool of generalists – all of whom are multi-skilled and can do any of the six steps to the required level of expertise.  A pool of generalists is a much more resilient-flow design.

And the key phrase here is ‘to the required level of expertise‘.

That is how to achieve Economy-of-Flow on a small scale without compromising either safety or quality.

Yes, there is still a need for a super-level of expertise to tackle the small number of complex problems – but that expertise is better delivered as a collective-expertise to an individual problem-focused process.  That is a completely different design.

Designing and delivering a system that that can achieve the synergy of the pool-of-generalists and team-of-specialists model requires addressing a key error of omission first: we are not trained how to do this.

We are not trained in Complex-Adaptive-System Improvement-by-Design.

So that is where we must start.


Ratio Hazards

waste_paper_shot_miss_150_wht_11853[Bzzzzz Bzzzzz] Bob’s phone was on silent but the desktop amplified the vibration and heralded the arrival of Leslie’s weekly ISP coaching call.

<Bob> Hi Leslie.  How are you today and what would you like to talk about?

<Leslie> Hi Bob.  I am well and I have an old chestnut to roast today … target-driven-behaviour!

<Bob> Excellent. That is one of my favorite topics. Is there a specific context?

<Leslie> Yes.  The usual desperate directive from on-high exhorting everyone to “work harder to hit the target” and usually accompanied by a RAG table of percentages that show just who is failing and how badly they are doing.

<Bob> OK. Red RAGs irritating the Bulls eh? Percentages eh? Have we talked about Ratio Hazards?

<Leslie> We have talked about DRATs … Delusional Ratios and Arbitrary Targets as you call them. Is that the same thing?

<Bob> Sort of. What happened when you tried to explain DRATs to those who are reacting to these ‘desperate directives’?

<Leslie> The usual reply is ‘Yes, but that is how we are required to report our performance to our Commissioners and Regulatory Bodies.’

<Bob> And are the key performance indicators that are reported upwards and outwards also being used to manage downwards and inwards?  If so, then that is poor design and is very likely to be contributing to the chaos.

<Leslie> Can you explain that a bit more? It feels like a very fundamental point you have just made.

 <Bob> OK. To do that let us work through the process by which the raw data from your system is converted into the externally reported KPI.  Choose any one of your KPIs

<Leslie> Easy! The 4-hour A&E target performance.

<Bob> What is the raw data that goes in to that?

<Leslie> The percentage of patients who breach 4-hours per day.

<Bob> And where does that ratio come from?

<Leslie> Oh! I see what you mean. That comes from a count of the number of patients who are in A&E for more than 4 hours divided by a count of the number of patients who attended.

<Bob> And where do those counts come come from?

<Leslie> We calculate the time the patient is in A&E and use the 4-hour target to label them as breaches or not.

<Bob> And what data goes into the calculation of that time?

<Leslie>The arrival and departure times for each patient. The arrive and depart events.

<Bob>OK. Is that the raw data?

<Leslie>Yes. Everything follows from that.

<Bob> Good.  Each of these two events is a time – which is a continuous metric.  In principle,  we could in record it to any degree of precision we like – milliseconds if we had a good enough enough clock.

<Leslie> Yes. We record it to an accuracy of of seconds – it is when the patient is ‘clicked through’ on the computer.

<Bob> Careful Leslie, do not confuse precision with accuracy. We need both.

<Leslie> Oops! Yes I remember we had that conversation before.

<Bob> And how often is the A&E 4-hour target KPI reported externally?

<Leslie> Quarterly. We either succeed or fail each quarter of the financial year.

<Bob> That is a binary metric. An “OK or not OK”. No gray zone.

<Leslie> Yes. It is rather blunt but that is how we are contractually obliged to report our performance.

<Bob> OK. And how many patients per day on average come to A&E?

<Leslie> About 200 per day.

<Bob> So the data analysis process is boiling down about 36,000 pieces of continuous data into one Yes-or-No bit of binary data.

<Leslie> Yes.

<Bob> And then that one bit is used to drive the action of the Board: if it is ‘OK last quarter’ then there is no ‘desperate directive’ and if it is a ‘Not OK last quarter’ then there is.

<Leslie> Yes.

<Bob> So you are throwing away 99.9999% of your data and wondering why what is left is not offering much insight in what to do.

<Leslie>Um, I guess so … when you say it like that.  But how does that relate to your phrase ‘Ratio Hazards’?

<Bob> A ratio is just one of the many ways that we throw away information. A ratio requires two numbers to calculate it; and it gives one number as an output so we are throwing half our information away.  And this is an irreversible act.  Two specific numbers will give one ratio; but that ratio can be created by an infinite number possible pairs of numbers and we have no way of knowing from the ratio what specific pair was used to create it.

<Leslie> So a ratio is an exercise in obfuscation!

<Bob> Well put! And there is an even more data-wasteful behaviour that we indulge in. We aggregate.

<Leslie> By that do you mean we summarise a whole set of numbers with an average?

<Bob> Yes. When we average we throw most of the data away and when we average over time then we abandon our ability to react in a timely way.

<Leslie>The Flaw of Averages!

<Bob> Yes. One of them. There are many.

<Leslie>No wonder it feels like we are flying blind and out of control!

<Bob> There is more. There is an even worse data-wasteful behaviour. We threshold.

<Leslie>Is that when we use a target to decide if the lead time is OK or Not OK.

<Bob> Yes. And using an arbitrary target makes it even worse.

<Leslie> Ah ha! I see what you are getting at.  The raw event data that we painstakingly collect is a treasure trove of information and potential insight that we could use to help us diagnose, design and deliver a better service. But we throw all but one single solitary binary digit when we put it through the DRAT Processor.

<Bob> Yup.

<Leslie> So why could we not do both? Why could we not use use the raw data for ourselves and the DRAT processed data for external reporting.

<Bob> We could.  So what is stopping us doing just that?

<Leslie> We do not know how to effectively and efficiently interpret the vast ocean of raw data.

<Bob> That is what a time-series chart is for. It turns the thousands of pieces of valuable information onto a picture that tells a story – without throwing the information away in the process. We just need to learn how to interpret the pictures.

<Leslie> Wow! Now I understand much better why you insist we ‘plot the dots’ first.

<Bob> And now you understand the Ratio Hazards a bit better too.

<Leslie> Indeed so.  And once again I have much to ponder on. Thank you again Bob.

The Learning Labyrinth

Minecraft There is an amazing phenomenon happening right now – a whole generation of people are learning to become system designers and they are doing it by having fun.

There is a game called Minecraft which millions of people of all ages are rapidly discovering.  It is creative, fun and surprisingly addictive.

This is what it says on the website.

“Minecraft is a game about breaking and placing blocks. At first, people built structures to protect against nocturnal monsters, but as the game grew players worked together to create wonderful, imaginative things.”

The principle is that before you can build you have to dig … you have to gather the raw materials you need … and then you have to use what you have gathered in novel and imaginative ways.  You need tools too, and you need to learn what they are used for, and what they are useless for. And the quickest way to learn the necessary survival and creative  skills is by exploring, experimenting, seeking help, and sharing your hard-won knowledge and experience with others.

The same principles hold in the real world of Improvement Science.

The treasure we are looking for is less tangible though … but no less difficult to find … unless you know where to look.

The treasure we seek is learning; how to achieve significant and sustained improvement on all dimensions.

And there is a mountain of opportunity that we can mine into. It is called Reality.

And when we do that we uncover nuggets of knowledge, jewels of understanding, and pearls of wisdom.

There are already many tunnels that have been carved out by others who have gone before us. They branch and join to form a vast cave network. A veritable labyrinth. Complicated and not always well illuminated or signposted.

And stored in the caverns is a vast treasure trove of experience we can dip into – and an even greater horde of new treasure waiting to be discovered.

But even now there there is no comprehensive map of the labyrinth. So it is easy to get confused and to get lost. Not all junctions have signposts and not all the signposts are correct. There are caves with many entrances and exits, there are blind-ending tunnels, and there are many hazards and traps for the unwary.

So to enter the Learning Labyrinth and to return safety with Improvement treasure we need guides. Those who know the safe paths and the unsafe ones. And as we explore we all need to improve the signage and add warning signs where hazards lurk.

And we need to work at the edge of knowledge  to extend the tunnels further. We need to seal off the dead-ends, and to draw and share up-to-date maps of the paths.

We need to grow a Community of Improvement Science Minecrafters.

And the first things we need are some basic improvement tools and techniques … and they can be found here.

Germination

growing_blue_vine_scrolling_down_150_wht_247New ideas need time to germinate.

And seeds need soil – so if the context is toxic the seeds will remain dormant or die.

And gardeners need to have patience.

And gardeners need to prepare.  The seeds, the soil and to nurture and nourish the green shoots of innovation.

When a seed-of-change finds itself in fertile soil it will germinate.  That is just the first step.

The fragile new shoot of improvement must be watered and protected from harm as it grows taller and gains strength-of-evidence.

The goal is for the new growth to bear its own fruit, and its own seeds which then spread the proven practice far and wide.

Experienced Improvement Science Practitioners know this.

They know that when the seeds of a proven improvement meet resistance then the cultural soil is not ready.  A few hard winters may be needed to break up the clods. Or perhaps the sharp spade of an external inspection is needed to crack through the carapace of complacency.

And competition from the worthless weeds if weak thinking is always present. The bindweed of bureaucracy saps energy and enthusiasm and hacking at it is futile. It only grows even more vigorously.  Weeds need to be approached from the  roots upwards. Without roots they will wither.

Purpose, practice, patience, preparation and persistence are the characteristics that lead to sustained success.

And when the new fruit of the improvement tree are ready and the seeds are ripe it is important not to jealously protect and store them away from harsh critique … they need to be scattered to the four winds and to have an opportunity to find fertile soil elsewhere and to establish their own colonies.

Many will not succeed.  And a few will evolve into opportunities that were never anticipated.

That is the way of innovation, germination, dissemination and evolution.

That is the way of Improvement Science.

Feel the Fear

Change is scary.

Deliberately stepping out of our comfort zones is scary.

We feel the fear – but sometimes we do it anyway. Why? How?

What we do is that we prepare and the feeling of fear becomes diluted with a feeling of excitement – and when the balance is right we do it.

So what are the tell-tale signs?

Excitement is a positive emotion – so when we imagine the future and feel excited we unconsciously smile and we feel better afterwards.  We want to share our excitement. We tell others that we are looking forward to the future.

Like birthdays, and holidays, and a new house and a new job. New stuff is exciting when WE decide we want it.


Fear comes from being forced to change and from not having the opportunity to prepare.

Fear happens when change is sprung on us unexpectedly by chance or by someone else.

Fear is a negative emotion and we feel bad afterwards so we avoid it.

So if thinking about the future is dominated by a feeling of fear then we resist and we prevaricate and we get labelled as obstructive, and difficult and cynical.

And that makes the fear worse.


So the way to make the future feel exciting is:

1. Set a clear and constant win-win-win purpose.
2. Show that it is possible by sharing examples.
3. Show that it is achievable by sharing the step-by-step process.
4. Provide the opportunity for preparation.
5. Include those that the change affects to plan their own transition.
6. Ensure that those affected know their part in the process.

And do not underestimate how long this takes and how much repetition, and listening, and explanation and respectful challenge this takes – so the sooner this starts the better.

We hear the news, we feel the fear, we build the excitement and then we do it.

That is the way of change.


Synchronicity

Metronome[Beep, Beep, Beep, Beep, Beeeeep] The reminder roused Bob from deep reflection and he clicked the Webex link on his desktop to start the meeting. Leslie was already online.

<Bob> Hi Leslie. How are you? And what would you like to share and explore today?

<Leslie> Hi Bob, I am well thank you and I would like to talk about chaos again.

<Bob> OK. That is always a rich mine of new insights!  Is there a specific reason?

<Leslie>Yes. The story I want to share is of the chaos that I have been experiencing just trying to get a new piece of software available for my team to use.  You would not believe the amount of time, emails, frustration and angst it has taken to negotiate this through the ‘proper channels’.

<Bob> Let me guess … about six months?

<Leslie> Spot on! How did you know?

<Bob> Just prior experience of similar stories.  So what is your diagnosis of the cause of the chaos?

<Leslie> My intuition shouts at me that people are just being deliberately difficult and that makes me feel angry and want to shout at them … but I have learned that behaviour is counter-productive.

<Bob> So what did you do?

<Leslie> I escalated the ‘problem’ to my line manager.

<Bob> And what did they do?

<Leslie> I am not sure, I was not copied in, but it seemed to clear the ‘obstruction’.

<Bob> And were the ‘people’ you mentioned suddenly happy and willing to help?

<Leslie> Not really … they did what we needed but they did not seem very happy about it.

<Bob> OK.  You are describing a Drama Triangle, a game, and your behaviour was from the Persecutor role.

<Leslie>What! But I deliberately did not send any ANGRY emails or get into a childish argument. I escalated the issue I could not solve because that is what we are expected to do.

<Bob> Yes I know. If you had engaged in a direct angry conversation, by whatever means, that would have been an actively aggressive act.  By escalating the issue and someone Bigger having the angry conversation you have engaged in a passive aggressive act. It is still playing the game from the Persecutor role and in fact is the more common mode of Persecution.

<Leslie> But it got the barrier cleared and the problem sorted?

<Bob> And did it leave everyone feeling happier than before?

<Leslie> I guess not. I certainly felt like a bit of a ‘tale teller’ and the IT technician probably hates me and fears for his job, and the departmental heads probably distrust each other even more than before.

<Bob> So this approach may appear to work in the short term but it creates a much bigger long term problem – and it is that long term problem of ‘distrust’ that creates the chaos. So it is a self-sustaining design.

<Leslie> Oh dear! Is there a way to avoid this and to defuse the chronic distrust?

<Bob> Yes.  You have demonstrated a process that you would like to improve – you want the same short term outcome, your software installed and working, and you want it quicker and with less angst and leaving everyone feeling good about how they have played a part in achieving that objective.

<Leslie>Yes. That would be my ideal.

<Bob>So what is different between what you did and your ‘ideal’ scenario?  What did you do that you should not have and what did you not do that you could have?

<Leslie> Well I triggered off a drama  triangle which I should not have. I also assumed that the IT people would know what to do because I do not understand the technical nuances of getting new software procured and installed. What I could have done is make it much clearer for them what I needed, why I needed it and how and when I needed it.  I could have done a lot more homework before asking them for assistance. I could also have given my inner Chimp a banana and gone to talk to them face-to-face and ask their opinion  early on so I could see the problem from  their perspective as well as mine.

<Bob> Yes – that all sounds reasonable and respectful.  What you are doing is ‘synchronising‘.  You are engaging in understanding the process well enough so that you can align all the actions that need to be done, in the correct order and then sharing that.  It is rather like being the composer of a piece of music – you share the score so that the individual players know what to do and when.  There is one other task you need to do.

<Leslie>I need to be the conductor!

<Bob> Yes.  You are the metronome.  You set the pace and guide the orchestra. They are the specialists with their instruments – that is not your role.

<Leslie> And when I do that then the music is harmonious and pleasing-to-the-ear; not a chaotic cacophony!

<Bob> Indeed … and the music is the voice of the system – and is the feedback that everyone hears – and not only do the musicians derive pleasure from contributing then the wider audience will hear what can be achieved and see how it is achieved.

<Leslie> Wow!  That musical metaphor works really well for me. Thanks Bob, I need to go and work on my communicating, composing and conducting capabilities.

Alignment of Purpose

woman_back_and_forth_questions_150_wht_12477<Lesley> Hi Bob, how are you today?

<Bob> I’m OK thanks Lesley. Having a bit of a break from the daily grind.

<Lesley> Oh! I am sorry, I had no idea you were on holiday. I will call when you are back at work.

<Bob> No need Lesley. Our chats are always a welcome opportunity to reflect and learn.

<Lesley> OK, if you are sure.  The top niggle on my list at the moment is that I do not feel my organisation values what I do.

<Bob> OK. Have you done the diagnostic Right-2-Left Map® backwards from that top niggle?

<Lesley>Yes. The final straw was that I was asked to justify my improvement role.

<Bob> OK, and before that?

<Lesley> There have been some changes in the senior management team.

<Bob> OK. This sounds like the ‘New Brush Sweeps Clean’ effect.

<Lesley> I have heard that phrase before. What does it mean in this context?

<Bob> Senior management changes are very disruptive events. The more senior the change the more disruptive it is.  Let us call it a form of ‘Disruptive Innovation’.  The trigger for the change is important.  One trigger might be a well-respected and effective leader retiring or moving to an even more senior role.  This leaves a leadership gap which is an opportunity for someone to grow and develop.  Another trigger might be a less-respected  and ineffective leader moving on and leaving a trail of rather-too-visible failures. It is the latter tends to be associated with the New Broom effect.

<Lesley> How is that?

<Bob>Well, put yourself in the shoes of the New Leader who has inherited a Trail of Disappointment – you need to establish your authority and expectation quickly and decisively. Ambiguity and lack of clarity will only contribute to further disappointment.  So you have to ask everyone to justify what they do.  And if they cannot then you need to know that.  And if they can then you need to decide if what they do is aligned with your purpose.  This is the New Brush.

<Lesley> So what if I can justify what I do and that does not fit with the ‘New Leader’s Plan’?

<Bob> If what you do is aligned to your Life Purpose but not with the New Brush then you have to choose.  And experience shows that the road to long term personal happiness is the one the aligns with your individual purpose.  And often it is just a matter of timing. The New Brush is indiscriminate and impatient – anything that does not fit neatly into the New Plan has to go.

<Lesley> OK my purpose is to improve the safety, flow, quality and productivity of healthcare processes – for the benefit of all. That is not negotiable. It is what fires my passion and fuels my day.  So does it matter really where or how I do that?

<Bob> Not really.  You do need be mindful of the pragmatic constraints though … your life circumstances.  There are many paths to your Purpose, so it is wise to choose one that is low enough risk to both you and those you love.

<Lesley> Ah! Now I see why you say that timing is important. You need to prepare to be able to make the decision.  You do not what to be caught by surprise and off balance.

<Bob>Yes. That is why as an ISP you always start with your own Purpose and your own Right-2-Left Map®.  Then you will know what to prepare and in what order so that you have the maximum number of options when you have to make a choice.  Sometimes the Universe will create the trigger and sometimes you have to initiate it yourself.

<Lesley> So this is just another facet of Improvement Science?

<Bob>  Yes.

Our Iceberg Is Melting

hold_your_ground_rope_300_wht_6223[Dring Dring] The telephone soundbite announced the start of the coaching session.

<Bob> Good morning Leslie. How are you today?

<Leslie> I have been better.

<Bob> You seem upset. Do you want to talk about it?

<Leslie> Yes, please. The trigger for my unhappiness is that last week I received an email demanding that I justify the time I spend doing improvement work and  a summons to a meeting to ‘discuss some issues that have been raised‘.

<Bob> OK. I take it that you do not know what or who has triggered this inquiry.

<Leslie> You are correct. My working hypothesis is that it is the end of the financial year and budget holders are looking for opportunities to do some pruning – to meet their cost improvement program targets!

<Bob> So what is the problem? You have shared the output of your work. You have demonstrated significant improvements in safety, flow, quality and productivity and you have described both them and the methodology clearly.

<Leslie> I know. That us why I was so upset to get this email. It is as if everything that we have achieved has been ignored. It is almost as if it is resented.

<Bob> Ah! You may well be correct.  This is the nature of paradigm shifts. Those who have the greatest vested interest in the current paradigm get spooked when they feel it start to wobble. Each time you share the outcome of your improvement work you create emotional shock-waves. The effects are cumulative and eventually there will be is a ‘crisis of confidence’ in those who feel most challenged by the changes that you are demonstrating are possible.  The whole process is well described in Thomas Kuhn’s The Structure of Scientific Revolutions. That is not a book for an impatient reader though – for those who prefer something lighter I recommend “Our Iceberg is Melting” by John Kotter.

<Leslie> Thanks Bob. I will get a copy of Kotter’s book – that sounds more my cup of tea. Will that tell me what to do?

<Bob> It is a parable – a fictional story of a colony of penguins who discover that their iceberg is melting and are suddenly faced with a new and urgent potential risk of not surviving the storms of the approaching winter. It is not a factual account of a real crisis or a step-by-step recipe book for solving all problems  – it describes some effective engagement strategies in general terms.

<Leslie> I will still read it. What I need is something more specific to my actual context.

<Bob> This is an improvement-by-design challenge. The only difference from the challenges you have done already is that this time the outcome you are looking for is a smooth transition from the ‘old’ paradigm to the ‘new’ one.  Kuhn showed that this transition will not start to happen until there is a new paradigm because individuals choose to take the step from the old to the new and they do not all do that at the same time.  Your work is demonstrating that there is a new paradigm. Some will love that message, some will hate it. Rather like Marmite.

<Leslie> Yes, that make sense.  But how do I deal with an unseen enemy who is stirring up trouble behind my back?

<Bob> Are you are referring to those who have ‘raised some issues‘?

<Leslie> Yes.

<Bob> They will be the ones who have most invested in the current status quo and they will not be in senior enough positions to challenge you directly so they are going around spooking the inner Chimps of those who can. This is expected behaviour when the relentlessly changing reality starts to wobble the concrete current paradigm.

<Leslie> Yes! That is  exactly how it feels.

<Bob> The danger lurking here is that your inner Chimp is getting spooked too and is conjuring up Gremlins and Goblins from the Computer! Left to itself your inner Chimp will steer you straight into the Victim Vortex.  So you need to take it for a long walk, let it scream and wave its hairy arms about, listen to it, and give it lots of bananas to calm it down. Then put your put your calmed-down Chimp into its cage and your ‘paradigm transition design’ into the Computer. Only then will you be ready for the ‘so-justify-yourself’ meeting.  At the meeting your Chimp will be out of its cage like a shot and interpreting everything as a threat. It will disable you and go straight to the Computer for what to do – and it will read your design and follow the ‘wise’ instructions that you have put in there.

<Leslie> Wow! I see how you are using the Chimp Paradox metaphor to describe an incredibly complex emotional process in really simple language. My inner Chimp is feeling happier already!

<Bob> And remember that you are in all in the same race. Your collective goal is to cross the finish line as quickly as possible with the least chaos, pain and cost.  You are not in a battle – that is lose-lose inner Chimp thinking.  The only message that your interrogators must get from you is ‘Win-win is possible and here is how we can do it‘. That will be the best way to soothe their inner Chimps – the ones who fear that you are going to sink their boat by rocking it.

<Leslie> That is really helpful. Thank you again Bob. My inner Chimp is now snoring gently in its cage and while it is asleep I have some Improvement-by-Design work to do and then some Computer programming.

Navigating the Nerve Curve

Nerve_CurveThe emotional roller-coaster ride that is associated with change, learning and improvement is called the Nerve Curve.

We are all very familiar with the first stages – of Shock, Denial, Anger, Bargaining, Depression and Despair.  We are less familiar with the stages associated with the long climb out to Resolution: because most improvement initiatives fail for one reason of another.

The critical first step is to “Disprove Impossibility” and this is the first injection of innovation. Someone (the ‘innovator’) discovers that what was believed to be impossible is not. They only have to have one example too. One Black Swan.

The tougher task is to influence those languishing in the ‘Depths of Despair’ that there is hope and that there is a ‘how’. This is not easy because cynicism is toxic to innovation.  So an experienced Improvement Science Practitioner (ISP) bypasses the cynics and engages with the depressed-but-still-healthy-sceptics.

The challenge now is how to get a shed load of them up the hill.

When we first learn to drive we start on the flat, not on hills,  for a very good reason. Safety.

We need to learn to become confident with the controls first. The brake, the accelerator, the clutch and the steering wheel.  This takes practice until it is comfortable, unconscious and almost second nature. We want to achieve a smooth transition from depression to delight, not chaotic kangaroo jumps!

Only when we can do that on the flat do we attempt a hill-start. And the key to a successful hill start is the sequence.  Hand brake on  for safety, out of gear, engine running, pointing at the goal. Then we depress the clutch and select a low gear – we do not want to stall. Speed is not the goal. Safety comes first. Then we rev the engine to give us the power we need to draw on. Then we ease the clutch until the force of the engine has overcome the force of gravity and we feel the car wanting to move forward. And only then do we ease the handbrake off, let the clutch out more and hit the gas to keep the engine revs in the green.

So when we are planning to navigate a group of healthy sceptics up the final climb of the Nerve Curve we need to plan and prepare carefully.

What is least likely to be successful?

Well, if all we have is our own set of wheels,  a cheap and cheerful mini-motor, then it is not going to be a good idea to shackle a trailer to it; fill the trailer with sceptics and attempt a hill start. We will either stall completely or burn out our clutch. We may even be dragged backwards into the Cynic Infested Toxic Swamp.

So what if we hire a bus, load up our sceptical passengers, and have a go.  We may be lucky –  but if we have no practice doing hill starts with a full bus then we could be heading for disappointment; or disaster.

So what is a safer plan:
1) First we need to go up the mountain ourselves to demonstrate it is possible.
2) Then we take one or two of the least sceptical up in our car to show it is safe.
3) We then invite those sceptics with cars to learn how to do safe hill starts.
4) Finally we ask the ex-sceptics to teach the fresh-sceptics how to do it.

Brmmmm Brmmmm. Off we go.

Jiggling

hurry_with_the_SFQP_kit[Dring] Bob’s laptop signaled the arrival of Leslie for their regular ISP remote coaching session.

<Bob> Hi Leslie. Thanks for emailing me with a long list of things to choose from. It looks like you have been having some challenging conversations.

<Leslie> Hi Bob. Yes indeed! The deepening gloom and the last few blog topics seem to be polarising opinion. Some are claiming it is all hopeless and others, perhaps out of desperation, are trying the FISH stuff for themselves and discovering that it works.  The ‘What Ifs’ are engaged in war of words with the ‘Yes Buts’.

<Bob> I like your metaphor! Where would you like to start on the long list of topics?

<Leslie> That is my problem. I do not know where to start. They all look equally important.

<Bob> So, first we need a way to prioritise the topics to get the horse-before-the-cart.

<Leslie> Sounds like a good plan to me!

<Bob> One of the problems with the traditional improvement approaches is that they seem to start at the most difficult point. They focus on ‘quality’ first – and to be fair that has been the mantra from the gurus like W.E.Deming. ‘Quality Improvement’ is the Holy Grail.

<Leslie>But quality IS important … are you saying they are wrong?

<Bob> Not at all. I am saying that it is not the place to start … it is actually the third step.

<Leslie>So what is the first step?

<Bob> Safety. Eliminating avoidable harm. Primum Non Nocere. The NoNos. The Never Events. The stuff that generates the most fear for everyone. The fear of failure.

<Leslie> You mean having a service that we can trust not to harm us unnecessarily?

<Bob> Yes. It is not a good idea to make an unsafe design more efficient – it will deliver even more cumulative harm!

<Leslie> OK. That makes perfect sense to me. So how do we do that?

<Bob> It does not actually matter.  Well-designed and thoroughly field-tested checklists have been proven to be very effective in the ‘ultra-safe’ industries like aerospace and nuclear.

<Leslie> OK. Something like the WHO Safe Surgery Checklist?

<Bob> Yes, that is a good example – and it is well worth reading Atul Gawande’s book about how that happened – “The Checklist Manifesto“.  Gawande is a surgeon who had published a lot on improvement and even so was quite skeptical that something as simple as a checklist could possibly work in the complex world of surgery. In his book he describes a number of personal ‘Ah Ha!’ moments that illustrate a phenomenon that I call Jiggling.

<Leslie> OK. I have made a note to read Checklist Manifesto and I am curious to learn more about Jiggling – but can we stick to the point? Does quality come after safety?

<Bob> Yes, but not immediately after. As I said, Quality is the third step.

<Leslie> So what is the second one?

<Bob> Flow.

There was a long pause – and just as Bob was about to check that the connection had not been lost – Leslie spoke.

<Leslie> But none of the Improvement Schools teach basic flow science.  They all focus on quality, waste and variation!

<Bob> I know. And attempting to improve quality before improving flow is like papering the walls before doing the plastering.  Quality cannot grow in a chaotic context. The flow must be smooth before that. And the fear of harm must be removed first.

<Leslie> So the ‘Improving Quality through Leadership‘ bandwagon that everyone is jumping on will not work?

<Bob> Well that depends on what the ‘Leaders’ are doing. If they are leading the way to learning how to design-for-safety and then design-for-flow then the bandwagon might be a wise choice. If they are only facilitating collaborative agreement and group-think then they may be making an unsafe and ineffective system more efficient which will steer it over the edge into faster decline.

<Leslie>So, if we can stabilize safety using checklists do we focus on flow next?

<Bob>Yup.

<Leslie> OK. That makes a lot of sense to me. So what is Jiggling?

<Bob> This is Jiggling. This conversation.

<Leslie> Ah, I see. I am jiggling my understanding through a series of ‘nudges’ from you.

<Bob>Yes. And when the learning cogs are a bit rusty, some Improvement Science Oil and a bit of Jiggling is more effective and much safer than whacking the caveman wetware with a big emotional hammer.

<Leslie>Well the conversation has certainly jiggled Safety-Flow-Quality-and-Productivity into a sensible order for me. That has helped a lot. I will sort my to-do list into that order and start at the beginning. Let me see. I have a plan for safety, now I can focus on flow. Here is my top flow niggle. How do I design the resource capacity I need to ensure the flow is smooth and the waiting times are short enough to avoid ‘persecution’ by the Target Time Police?

<Bob> An excellent question! I will send you the first ISP Brainteaser that will nudge us towards an answer to that question.

<Leslie> I am ready and waiting to have my brain-teased and my niggles-nudged!

Our Irrational Inner Chimp

single_file_line_PA_150_wht_3113The modern era in science started about 500 years ago when an increasing number of people started to challenge the dogma that our future is decided by Fates and Gods. That we had no influence. And to appease the ‘Gods’ we had to do as we were told. That was our only hope of Salvation.

This paradigm came under increasing pressure as the evidence presented by Reality did not match the Rhetoric.  Many early innovators paid for their impertinence with their fortunes, their freedom and often their future. They were burned as heretics.

When the old paradigm finally gave way and the Age of Enlightenment dawned the pendulum swung the other way – and the new paradigm became the ‘mechanical universe’. Isaac Newton showed that it was possible to predict, with very high accuracy, the motion of the planets just by adopting some simple rules and a new form of mathematics called calculus. This opened a door into a more hopeful world – if Nature follows strict rules and we know what they are then we can learn to control Nature and get what we need without having to appease any Gods (or priests).

This was the door to the Industrial Revolutions – there have been more that one – each lasting about 100 years (18th C, 19th C and 20th C). Each was associated with massive population growth as we systematically eliminated the causes of early mortality – starvation and infectious disease.

But not everything behaved like the orderly clockwork of the planets and the pendulums. There was still the capricious and unpredictable behaviour that we call Lady Luck.  Had the Gods retreated but were still playing dice?

Progress was made here too – and the history of the ‘understanding of chance’ is peppered with precocious and prickly mathematical savants who discovered that chance follows rules too. Probability theory was born and that spawned a troublesome child called Statistics. This was a trickier one to understand. To most people statistics is just mathematical gobbledygook.

But from that emerged a concept called the Rational Man – which underpinned the whole of Economic Theory for 250 years. Until very recently.  The RM hypothesis stated that we make unconscious but rational judgements when presented with uncertain win/lose choices.  And from that seed sprouted concepts such as the Law of Supply and Demand – when the supply of things we  demand are limited then we (rationally) value them more and will choose to pay more so prices go up so fewer can afford them so demand drops. Foxes and Rabbits. A negative feedback loop. The economic system becomes self-adjusting and self-stabilising.  The outcome of this assumption is a belief that ‘because people are collectively rational the economic system will be self-stabilising and it will correct the adverse short term effects of any policy blunders we make‘.  The ‘let-the-market-decide’ belief that experimental economic meddling is harmless over the long term and what is learned from ‘laissez-faire’ may even be helpful. It is a no-lose long term improvement strategy. Losers are just unlucky, stupid or both.

In 2002 the Nobel Prize for Economics was not awarded to an economist. It was awarded to a psychologist – Daniel Kahneman – who showed that the model of the Rational Man did not stand up to rigorous psychological experiment.  Reality demonstrated we are Irrational Chimps. The economists had omitted to test their hypothesis. Oops!


This lesson has many implications for the Science of Improvement.  One of which is a deeper understanding of the nemesis of improvement – resistance to change.

One of the surprising findings is that our judgements are biased – and our bias operates at an unconscious level – what Kahneman describes as the System One level. Chimp level. We are not aware we are making biased decisions.

For example. Many assume that we prefer certainty to uncertainty. We fear the unpredictable. We avoid it. We seek the predictable and the stable. And we will put up with just about anything so long as it is predictable. We do not like surprises.  And when presented with that assertion most people nod and say ‘Yes’ – that feels right.

We also prefer gain to loss.  We love winning. We hate losing. This ‘competitive spirit’ is socially reinforced from day one by our ‘pushy parents’ – we all know the ones – but we all do it to some degree. Do better! Work harder! Be a success! Optimize! Be the best! Be perfect! Be Perfect! BE PERFECT.

So which is more important to us? Losing or uncertainty? This is one question that Kahneman asked. And the answer he discovered was surprising – because it effectively disproved the Rational Man hypothesis.  And this is how a psychologist earned a Nobel Prize for Economics.

Kahneman discovered that loss is more important to us than uncertainty.

To demonstrate this he presented subjects with a choice between two win/lose options; and he presented the choice in two ways. To a statistician and a Rational Man the outcomes were exactly the same in terms of gain or loss.  He designed the experiment to ensure that it was the unconscious judgement that was being measured – the intuitive gut reaction. So if our gut reactions are Rational then the choice and the way the choice was presented would have no significant effect.

There was an effect. The hypothesis was disproved.

The evidence showed that our gut reactions are biased … and in an interesting way.

If we are presented with the choice between a certain gain and an uncertain gain/loss (so the average gain is the same) then we choose the certain gain much more often.  We avoid uncertainty. Uncertainly =1 Loss=0.

BUT …

If we are presented with a choice between certain loss and an uncertain loss/gain (so the average outcome is again the same) then we choose the uncertain option much more often. This is exactly the opposite of what was expected.

And it did not make any difference if the subject knew the results of the experiment before doing it. The judgement is made out of awareness and communicated to our consciousness via an emotion – a feeling – that biases our slower, logical, conscious decision process.

This means that the sense of loss has more influence on our judgement than the sense of uncertainty.

This behaviour is hard-wired. It is part of our Chimp brain design. And once we know this we can see the effect of it everywhere.

1. We will avoid the pain of uncertainty and resist any change that might deliver a gain when we believe that future loss is uncertain. We are conservative and over-optimistic.

2. We will accept the pain of uncertainty and only try something new (and risky) when we believe that to do otherwise will result in certain loss. The Backs Against The Wall scenario.  The Cornered Rat is Unpredictable and Dangerous scenario.

This explains why we resist any change right up until the point when we see Reality clearly enough to believe that we are definitely going to lose something important if we do nothing. Lose our reputation, lose our job, lose our security, lose our freedom or lose our lives. That is a transformational event.  A Road to Damascus moment.

monkey_on_back_anim_150_wht_11200Understanding that we behave like curious, playful, social but irrational chimps is one key to unlocking significant and sustained improvement.

We need to celebrate our inner chimp – it is key to innovation.

And we need to learn how to team up with our inner chimp rather than be hijacked by it.

If we do not we will fail – the Laws of Physics, Probability and Psychology decree it.

Sticks or Carrots?

boss_dangling_carrot_for_employee_anim_150_wht_13061[Beep Beep] Bob’s laptop signaled the arrival of Leslie to their regular Webex mentoring session. Bob picked up the phone and connected to the conference call.

<Bob> Hi Leslie, how are you today?

<Leslie> Great thanks Bob. I am sorry but that I do not have a red-hot burning issue to talk about today.

<Bob> OK – so your world is completely calm and orderly now. Excellent.

<Leslie> I wish! The reason is that I have been busy preparing for the monthly 1-2-1 with my boss.

<Bob> OK. So do you have a few minutes to talk about that?

<Leslie> What can I tell you about it?

<Bob> Can you just describe the purpose and the process for me?

<Leslie> OK. The purpose is improvement – for both the department and the individual. The process is that all departmental managers have an annual appraisal based on their monthly 1-2-1 chats and the performance scores for their departments are used to reward the top 15% and to ‘performance manage’ the bottom 15%.

<Bob> H’mmm.  What is the commonest emotion that is associated with this process?

<Leslie> I would say somewhere between severe anxiety and abject terror. No one looks forward to it. The annual appraisal feels like a lottery where the odds are stacked against you.

<Bob> Can you explain that a bit more for me?

<Leslie> Well, the most fear comes from being in the bottom 15% – the fear of being ‘handed your hat’ so to speak. Fortunately that fear motivates us to try harder and that usually saves us from the chopper because our performance improves.  The cost is the extra stress, working late and taking ‘stuff’ home.

<Bob> OK. And the anxiety?

<Leslie> Paradoxically that mostly comes from the top 15%. They are anxious to sustain their performance. Most do not and the Boss’s Golden Manager can crash spectacularly! We have seen it so often. It is almost as if being the Best carries a curse! So most of us try to stay in the middle of the pack where we do not stick out – a sort of safety in the herd strategy.  It is illogical I know because there is always a ‘top’ 15% and a ‘bottom’ 15%.

<Bob> You mentioned before that it feels like a lottery. How come?

<Leslie> Yes – it feels like a lottery but I know it has a rational scientific basis. Someone once showed me the ‘statistically significant evidence’ that proves it works.

<Bob> That what works exactly?

<Leslie> That sticks are more effective than carrots!

<Bob> Really! And what does the performance run charts look like – over the long term – say monthly over 2-3 years?

<Leslie> That is a really good question. They are surprisingly stable – well completely stable in fact. The wobble up and down of course but there is no sign of improvement over the long term – no trend. If anything it is the other way.

<Bob> So what is the rationale for maintaining the stick-is-better-than-the-carrot policy?

<Leslie> Ah! The message we are getting  is ‘as performance is not improving and sticks have been scientifically proven to be more effective than carrots then we will be using a bigger stick in future‘.

<Bob> Hence the atmosphere of fear and anxiety?

<Leslie> Exactly. But that is the way it must be I suppose.

<Bob> Actually it is not. This is an invalid design based on rubbish intuitive assumptions and statistical smoke-and-mirrors that creates unmeasurable emotional pain and destroys both people and organisations!

<Leslie> Wow! Bob! I have never heard you use language like that. You are usually so calm and reasonable. This must be really important!

 <Bob> It is – and for that reason I need to shock you out of your apathy  – and I can do that best by you proving it to yourself – scientifically – with a simple experiment. Are you up for that?

<Leslie> You betcha! This sounds like it is going to be interesting. I had better fasten my safety belt! The Nerve Curve awaits.


 The Stick-or-Carrot Experiment

<Bob> Here we go. You will need five coins, some squared-paper and a pencil. Coloured ones are even better.

<Leslie> OK. Does it matter what sort of coins?

<Bob> No. Any will do. Imagine you have four managers called A,B,C and D respectively.  Each month the performance of their department is measured as the number of organisational targets that they are above average on. Above average is like throwing a ‘head’, below average is like throwing a ‘tail’. There are five targets – hence the coins

<Leslie>OK. That makes sense – and it feels better to use the measured average – we have demonstrated that arbitrary performance targets are dangers – especially when imposed blindly across all departments.

<Bob> Indeed. So can you design a score sheet to track the data for the experiment.

<Leslie>Give me a minute.  Will this suffice?

Stick_and_Carrot_Fig1<Bob> Perfect! Now simulate a month by tossing all five coins – once for each manager – and record the outcome of each as H to T , then tot up the number of heads for each manager.

<Leslie>  OK … here is what I got.

Stick_and_Carrot_Fig2<Bob>Good. Now repeat this 11 more times to give you the results for a whole year.  In the n(Heads) column colour the boxes that have scores of zero or one as red – these are the Losers. Then colour the boxes that have 4 or 5 as green – these are the Winners.

<Leslie>OK, that will take me a few minutes – do you want to get a coffee or something.

[Five minutes later]

Here you go. That gives 96 opportunities to win or lose and I counted 9 Losers and 9 Winners so just under 20% for each. The majority were in the unexceptional middle. The herd.

Stick_and_Carrot_Fig3<Bob> Excellent.  A useful way to visualise this is using a Tally chart. Just run down the column of n(Heads) and create the Tally chart as you go. This is one of the oldest forms of counting in existence. There are fossil records that show Tally charts being used thousands of years ago.

<Leslie> I think I understand what you mean. We do not wait until all the data is in then draw the chart, we update it as we go along – as the data comes in.

<Bob> Spot on!

<Leslie> Let me see. Wow! That is so cool!  I can see the pattern appearing almost magically – and the more data I have the clearer the pattern is.

 <Bob>Can you show me?

<Leslie> Here we go.

Stick_and_Carrot_Fig4<Bob> Good.  This is the expected picture. If you repeated this many times you would get the same general pattern with more 2 and 3 scores.

Now I want you to do an experiment.

Assume each manager that is classed as a Winner in one month is given a reward – a ‘pat on the back’ from their Boss. And each manager that is classed as a Loser is given a ‘written warning’. Now look for  the effect that this has.

<Leslie> But we are using coins – which means the outcome is just a matter of chance! It is a lottery.

<Bob> I know that and you know that but let us assume that the Boss believes that the monthly feedback has an effect. The experiment we are doing is to compare the effect of the carrot with the stick. The Boss wants to know which results in more improvement and to know that with scientific and statistical confidence!

<Leslie> OK. So what I will do is look at the score the following month for each manager that was either a Winner or a  Loser; work out the difference, and then calculate the average of those differences and compare them with each other. That feels suitably scientific!

<Bob> OK. What do you get.

<Leslie> Just a minute, I need to do this carefully. OK – here it is.

<Bob>Stick_and_Carrot_Fig5 Excellent.  Just eye-balling the ‘Measured improvement after feedback’ columns I would say the Losers have improved and the Winners have deteriorated!

<Leslie> Yes! And the Losers have improved by 1.29 on average and the Winners have deteriorated by 1.78 – and that is a big difference for such small sample. I am sure that with enough data this would be a statistically significant difference! So it is true, sticks work better than carrots!

<Bob>Not so fast. What you are seeing is a completely expected behaviour called “Regression to the Mean“. Remember we know that the score for each manager each month is the result of a game of chance, a coin toss, a lottery. So no amount of stick or carrot feedback is going to influence that.

<Leslie>But the data is saying there is a difference! And that feels like the experience we have – and why fear stalks the management corridors. This is really confusing!

<Bob>Remember that confusion arises from invalid or conflicting unconscious assumptions. There is a flaw in the statistical design of this experiment. The ‘obvious’ conclusion is invalid because of this flaw. And do not be too hard on yourself. The flaw eluded mathematicians for centuries. But now you know there is one can you find it?

<Leslie>OMG!  The use of the average to classify the managers into Winners or Losers is the flaw!  That is just a lottery. Who the managers are is irrelevant. This is just a demonstration of how chance works.

But that means … OMG!  If the conclusion is invalid then sticks are not better than carrots and we have been brain-washed for decades into accepting a performance management system that is invalid – and worse still is used to ‘scientifically’ justify systematic persecution! I can see now why you get so angry!

<Bob>Bravo Leslie.  We  need to check your understanding. Does that mean carrots are better than sticks?

<Leslie>No!  The conclusion is invalid because the assumptions are invalid and the design is fatally flawed. It does not matter what the conclusion actually is.

<Bob>Excellent. So what conclusion can you draw?

<Leslie>That this short-term carrot-or-stick feedback design for achieving improvement in a stable system  is both ineffective and emotionally damaging. In fact it could well be achieving precisely the opposite effect that it is intended to. It may be preventing improvement! But the story feels so plausible and the data appears to back it up. What is happening here is we are using statistical smoke-and-mirrors to justify what we have already decided – and only an true expert would spot the flaw! Once again our intuition has tricked us!

<Bob>Well done! And with this new insight – how would you do it differently?  What would be a better design?

<Leslie>That is a very good question. I am going to have to think about that – before my 1-2-1 tomorrow. I wonder what might happen if I show this demonstration to my Boss? Thanks Bob, as always … lots of food for thought.


What is my P.A.R.T?

four_way_puzzle_people_200_wht_4883Improvement implies change, but change does not imply improvement.

Change follows action. Action follows planning. Effective planning follows from an understanding of the system because it is required to make the wise decisions needed to achieve the purpose.

The purpose is the intended outcome.

Learning follows from observing the effect of change – whatever it is. Understanding follows from learning to predict the effect of both actions and in-actions.

All these pieces of the change jigsaw are different and they are inter-dependent. They fit together. They are a system.

And we can pick out four pieces: the Plan piece, the Action piece, the Observation piece and the Learning piece – and they seem to follow that sequence – it looks like a learning cycle.

This is not a new idea.

It is the same sequence as the Scientific Method: hypothesis, experiment, analysis, conclusion. The preferred tool of  Academics – the Thinkers.

It is also the same sequence as the Shewhart Cycle: plan, do, check, act. The preferred tool of the Pragmatists – the Doers.

So where does all the change conflict come from? What is the reason for the perpetual debate between theorists and activists? The incessant game of “Yes … but!”

One possible cause was highlighted by David Kolb  in his work on ‘experiential learning’ which showed that individuals demonstrate a learning style preference.

We tend to be thinkers or doers and only a small proportion us say that we are equally comfortable with both.

The effect of this natural preference is that real problems bounce back-and-forth between the Tribe of Thinkers and the Tribe of Doers.  Together we are providing separate parts of the big picture – but as two tribes we appear to be unaware of the synergistic power of the two parts. We are blocked by a power struggle.

The Experiential Learning Model (ELM) was promoted and developed by Peter Honey and Alan Mumford (see learning styles) and their work forms the evidence behind the Learning Style Questionnaire that anyone can use to get their ‘score’ on the four dimensions:

  • Pragmatist – the designer and planner
  • Activist – the action person
  • Reflector – the observer and analyst
  • Theorist – the abstracter and hypothesis generator

The evidence from population studies showed that individuals have a preference for one of these styles, sometimes two, occasionally three and rarely all four.

That observation, together with the fact that learning from experience requires moving around the whole cycle, leads to an awareness that both individuals and groups can get ‘stuck’ in their learning preference comfort zone. If the learning wheel is unbalanced it will deliver a bumpy ride when it turns! So it may be more comfortable just to remain stationary and not to learn.

Which means not to change. Which means not to improve.


So if we are embarking on an improvement exercise – be it individual or collective – then we are committed to learning. So where do we start on the learning cycle?

The first step is action. To do something – and the easiest and safest thing to do is just look. Observe what is actually happening out there in the real world – outside the office – outside our comfort zone. We need to look outside our rhetorical inner world of assumptions, intuition and pre-judgements. The process starts with Study.

The next step is to reflect on what we see – we look in the mirror – and we compare what are actually seeing with what we expected to see. That is not as easy as it sounds – and a useful tool to help is to draw charts. To make it visual. All sorts of charts.

The result is often a shock. There is often a big gap between what we see and what we perceive; between what we expect and what we experience; between what we want and what we get; between our intent and our impact.

That emotional shock is actually what we need to power us through the next phase – the Realm of the Theorist – where we ask three simple questions:
Q1: What could be causing the reality that I am seeing?
Q2: How would I know which of the plausible causes is the actual cause?
Q3: What experiment can I do to answer my question and clarify my understanding of Reality?

This is the world of the Academic.

The third step is design an experiment to test our new hypothesis.  The real world is messy and complicated and we need to be comfortable with ‘good enough’ and ‘reasonable uncertainty’.  Design is about practicalities – making something that works well enough in practice – in the real world. Something that is fit-for-purpose. We are not expecting perfection; not looking for optimum; not striving for best – just significantly better than what we have now. And the more we can test our design before we implement it the better because we want to know what to expect before we make the change and we want to avoid unintended negative consequences – the NoNos. This is Plan.

twisting_arrow_200_wht_11738Then we act … and the cycle of learning has come one revolution … but we are not back at the start – we have moved forward. Our understanding is already different from when were were at this stage before: it is deeper and wider.  We are following the trajectory of a spiral – our capability for improvement is expanding over time.

So we need to balance our learning wheel before we start the journey or we will have a slow, bumpy and painful ride!

We need to study, then plan, then do, then study the impact.


One plausible approach is to stay inside our comfort zones, play to our strengths and to say “What we need is a team made of people with complementary strengths. We need a Department of Action for the Activists; a Department of Analysis for the Reflectors; a Department of Research for the Theorists and a Department of Planning for the Pragmatists.

But that is what we have now and what is the impact? The Four Departments have become super-specialised and more polarised.  There is little common ground or shared language.  There is no common direction, no co-ordination, no oil on the axle of the wheel of change. We have ground to a halt. We have chaos. Each part is working but independently of the others in an unsynchronised mess.

We have cultural fibrillation. Change output has dropped to zero.


A better design is for everyone to focus first on balancing their own learning wheel by actively redirecting emotional energy from their comfort zone, their strength,  into developing the next step in their learning cycle.

Pragmatists develop their capability for Action.
Activists develop their capability for Reflection.
Reflectors develop their capability for Hypothesis.
Theorists develop their capability for Design.

The first step in the improvement spiral is Action – so if you are committed to improvement then investing £10 and 20 minutes in the 80-question Learning Style Questionnaire will demonstrate your commitment to yourself.  And that is where change always starts.

The Shredder

figure_snowblowing_150_wht_13606It is the time of year when our minds turn to self-improvement.

New Year.

We re-affirm our Resolutions from last year and we vow to try harder this year. As we did last year. And the year before that. And we usually fail.

So why do we fail to keep our New Year Resolutions?

One reason is because we do not let go of the past. We get pulled back into old habits too easily. To get a new future we have to do some tidying up. We need to get The Shredder. We need to make the act of letting go irreversible.

Bzzzzzzz …. Aaaaah. That feels better.

Why does this work?

First, because it feels good to be taking definitive action.  We know that resolutions are just good intentions. It is not until we take action that change happens.  Many of us are weak on the Activist dimension. We talk a lot about what we should do but we do not walk as much as we could do.

Second, because  we can see the evidence of the improvement immediately. We get immediate, visual, positive feedback. That heap of old bills and emails and reports that we kept ‘just in case’ is no longer cluttering up our desks, our eyes, our minds and our lives.  And we have ‘recycled’ it which feels even better.

Third, because we have challenged our own Prevarication Policy. And if we can do that for ourselves we can, with some credibility, do the same for others. We feel more competent and more confident.

Fourth, because we have freed up valuable capacity to invest.  More space. More time (our prevarication before kept us busy but wasted our limited time). More motivation (trying to work around a pile of rubbish day-in and day-out is emotionally draining).

So all we need to do in the New Year is stay inside our circle of control and shred some years of accumulated rubbish.

figure_picking_up_trash_150_wht_11857And it is not just tangible rubbish we can dispose of.  We can shred some emotional garbage too. The list of “Yes … But” excuses that we cling on to.  The sack of guilt for past failures that weighs us down. The flag of fear that we wave when we surrender our independence and adopt the Victim role.  The righteous indignation that we use to hide our own self-betrayal.

And just by putting that lot through The Shredder we release the opportunity for improvement.

The rest just happens – as if by magic.

The Recipe for Chaos

boxes_group_PA4_150_wht_4916There are only four ingredients required to create Chaos.

The first is Time.

All processes and systems are time-dependent.

The second ingredient is a Metric of Interest (MoI).

That means a system performance metric that is important to all – such as a Safety or Quality or Cost; and usually all three.

The third ingredient is a feedback loop of a specific type – it is called a Negative Feedback Loop.  The NFL  is one that tends to adjust, correct and stabilise the behaviour of the system.

Negative feedback loops are very useful – but they have a drawback. They resist change and they reduce agility. The name is also a disadvantage – the word ‘negative feedback’ is often associated with criticism.

The fourth and final ingredient in our Recipe for Chaos is also a feedback loop but one of a different design – a Positive Feedback Loop (PFL)- one that amplifies variation and change.

Positive feedback loops are also very useful – they are required for agility – quick reactions to unexpected events. Fast reflexes.

The downside of a positive feedback loop is that increases instability.

The name is also confusing – ‘positive feedback’ is associated with encouragement and praise.

So, in this context it is better to use the terms ‘stabilizing feedback’ and ‘destabilizing feedback’  loops.

When we mix these four ingredients in just the right amounts we get a system that may behave chaotically. That is surprising and counter-intuitive. But it is how the Universe works.

For example:

Suppose our Metric of Interest is the amount of time that patients spend in a Accident and Emergency Department. We know that the longer this time is the less happy they are and the higher the risk of avoidable harm – so it is a reasonable goal to reduce it.

Longer-than-possible waiting times have many root causes – it is a non-specific metric.  That means there are many things that could be done to reduce waiting time and the most effective actions will vary from case-to-case, day-to-day and even minute-to-minute.  There is no one-size-fits-all solution.

This implies that those best placed to correct the causes of these delays are the people who know the specific system well – because they work in it. Those who actually deliver urgent care. They are the stabilizing ingredient in our Recipe for Chaos.

The destabilizing ingredient is the hit-the-arbitrary-target policy which drives a performance management feedback loop.

This policy typically involves:
(1) Setting a performance target that is desirable but impossible for the current design to achieve reliably;
(2) inspecting how close to the target we are; then
(3) using the real-time data to justify threats of dire consequences for failure.

Now we have a perfect Recipe for Chaos.

The higher the failure rate the more inspections, reports, meetings, exhortations, threats, interruptions, and interventions that are generated.  Fear-fuelled management meddling. This behaviour consumes valuable time – so leaves less time to do the worthwhile work. Less time to devote to safety, flow, and quality. The queues build and the pressure increases and the system becomes hyper-sensitive to small fluctuations. Delays multiply and errors are more likely and spawn more workload, more delays and more errors.  Tempers become frayed and molehills are magnified into mountains. Irritations become arguments.  And all of this makes the problem worse rather than better. Less stable. More variable. More chaotic. More dangerous. More expensive.

It is actually possible to write a simple equation that captures this complex dynamic behaviour characteristic of real systems.  And that was a very surprising finding when it was discovered in 1976 by a mathematician called Robert May.

This equation is called the logistic equation.

Here is the abstract of his seminal paper.

Nature 261, 459-467 (10 June 1976)

Simple mathematical models with very complicated dynamics

First-order difference equations arise in many contexts in the biological, economic and social sciences. Such equations, even though simple and deterministic, can exhibit a surprising array of dynamical behaviour, from stable points, to a bifurcating hierarchy of stable cycles, to apparently random fluctuations. There are consequently many fascinating problems, some concerned with delicate mathematical aspects of the fine structure of the trajectories, and some concerned with the practical implications and applications. This is an interpretive review of them.

The fact that this chaotic behaviour is completely predictable and does not need any ‘random’ element was a big surprise. Chaotic is not the same as random. The observed chaos in the urgent healthcare care system is the result of the design of the system – or more specifically the current healthcare system management policies.

This has a number of profound implications – the most important of which is this:

If the chaos we observe in our health care systems is the predictable and inevitable result of the management policies we ourselves have created and adopted – then eliminating the chaos will only require us to re-design these policies.

In fact we only need to tweak one of the ingredients of the Recipe for Chaos – such as to reduce the strength of the destabilizing feedback loop. The gain. The volume control on the variation amplifier!

This is called the MM factor – otherwise known as ‘Management Meddling‘.

We need to keep all four ingredients though – because we need our system to have both agility and stability.  It is the balance of ingredients that that is critical.

The flaw is not the Managers themselves – it is their learned behaviour – the Meddling.  This is learned so it can be unlearned. We need to keep the Managers but “tweak” their role slightly. As they unlearn their old habits they move from being ‘Policy-Enforcers and Fire-Fighters’ to becoming ‘Policy-Engineers and Chaos-Calmers’. They focus on learning to understand the root causes of variation that come from outside the circle of influence of the non-Managers.   They learn how to rationally and radically redesign system policies to achieve both agility and stability.

And doing that requires developing systemic-thinking and learning Improvement Science skills – because the causes of chaos are counter-intuitive. If it were intuitively-obvious we would have discovered the nature of chaos thousands of years ago. The fact that it was not discovered until 1976 demonstrates this fact.

It is our homo sapiens intuition that got us into this mess!  The inherent flaws of the chimp-ware between our ears.  Our current management policies are intuitively-obvious, collectively-agreed, rubber-stamped and wrong! They are part of the Recipe for Chaos.

And when we learn to re-design our system policies and upload the new system software then the chaos evaporates as if a magic wand had been waved.

And that comes as a really BIG surprise!

What also comes as a big surprise is just how small the counter-intuitive policy design tweaks often are.

Safe, smooth, efficient, effective, and productive flow is restored. Calm confidence reigns. Safety, Flow, Quality and Productivity all increase – at the same time.  The emotional storm clouds dissipate and the prosperity sun shines again.

Everyone feels better. Everyone. Patients, managers, and non-managers.

This is Win-Win-Win improvement by design. Improvement Science.

Unknown-Knowns

Locked_DoorIf we were exploring the corridors in an unfamiliar building and our way forward was blocked by a door that looked like this … we would suspect that something of value lay beyond.

We know there is an unknown.

The puzzle we have to solve to release the chain tells us this. This is called an “affordance” – the design of the lock tells us what we need to do.

More often what we need to know to move forward is unknown to us, and the problems we face afford us no clues as to how to solve them.  Worse than that – the clues they do offer are misleading.  Our intuition is tricked.  We do the ‘intuitively obvious’ thing and the problem gets worse.

It is easy to lose confidence, become despondent, and even to start to believe there is no solution. We begin to believe that the problem is impossible for us to solve.

Then one day someone shows us how to solve an “impossible” problem.  And with the benefit of our new perspective the solution looks simple, and how it works is now obvious. But only in retrospect.

Our unknown was known all along.  But not by us. We were ignorant.  We were agnostic.

And our intuitions are sometimes flaky, forgetful and fickle. They are not to be blindly trusted. And our egos are fragile too – we do not like to feel flaky, forgetful and fickle.  So, we lie to ourselves and we confuse obvious-in-hindsight with obvious-in-foresight.

They are not the same.

Suppose we now want to demonstrate our new understanding to someone else – to help them solve their “impossible” problem.  How do we do that?

Do we say “But it is obvious – if you cannot see it you must be blind or stupid!”

How can we say that when it was not obvious to us only a short time ago? Is our ego getting the in way again? Can our intuition or ego be trusted at all?

To help others gain insight and to help them deepen their understanding we must put ourselves back into the shoes we used to be in:  and we need to look at the problem again from their perspective.  With the benefit of the three views of the problem: our old one, their current one and our new one we may be able to then see where the Unknown-Known is for them – because it might be different.

Only then can we help them discover it for themselves; and then they can help others discover their Unknown-Knowns.  That is know knowledge and understanding spreads.

Understanding is the bridge between Knowledge and Wisdom.

And it is a wonderful thing to see someone move from conflict, through confusion to clarity by asking them just the right question, at just the right time, in just the right way.  For them.

Socrates, the Greek philosopher and teacher, knew how to do this a long time ago – which is why it is called the Socratic Method.

Space-and-Time

line_figure_phone_400_wht_9858<Lesley>Hi Bob! How are you today?

<Bob>OK thanks Lesley. And you?

<Lesley>I am looking forward to our conversation. I have two questions this week.

<Bob>OK. What is the first one?

<Lesley>You have taught me that improvement-by-design starts with the “purpose” question and that makes sense to me. But when I ask that question in a session I get an “eh?” reaction and I get nowhere.

<Bob>Quod facere bonum opus et quomodo te cognovi unum?

<Lesley>Eh?

<Bob>I asked you a purpose question.

<Lesley>Did you? What language is that? Latin? I do not understand Latin.

<Bob>So although you recognize the language you do not understand what I asked, the words have no meaning. So you are unable to answer my question and your reaction is “eh?”. I suspect the same is happening with your audience. Who are they?

<Lesley>Front-line clinicians and managers who have come to me to ask how to solve their problems. There Niggles. They want a how-to-recipe and they want it yesterday!

<Bob>OK. Remember the Temperament Treacle conversation last week. What is the commonest Myers-Briggs Type preference in your audience?

<Lesley>It is xSTJ – tough minded Guardians.  We did that exercise. It was good fun! Lots of OMG moments!

<Bob>OK – is your “purpose” question framed in a language that the xSTJ preference will understand naturally?

<Lesley>Ah! Probably not! The “purpose” question is future-focused, conceptual , strategic, value-loaded and subjective.

<Bob>Indeed – it is an iNtuitor question. xNTx or xNFx. Pose that question to a roomful of academics or executives and they will debate it ad infinitum.

<Lesley>More Latin – but that phrase I understand. You are right.  And my own preference is xNTP so I need to translate my xNTP “purpose” question into their xSTJ language?

<Bob>Yes. And what language do they use?

<Lesley>The language of facts, figures, jobs-to-do, work-schedules, targets, budgets, rational, logical, problem-solving, tough-decisions, and action-plans. Objective, pragmatic, necessary stuff that keep the operational-wheels-turning.

<Bob>OK – so what would “purpose” look like in xSTJ language?

<Lesley>Um. Good question. Let me start at the beginning. They came to me in desperation because they are now scared enough to ask for help.

<Bob>Scared of what?

<Lesley>Unintentionally failing. They do not want to fail and they do not need beating with sticks. They are tough enough on themselves and each other.

<Bob>OK that is part of their purpose. The “Avoid” part. The bit they do not want. What do they want? What is the “Achieve” part? What is their “Nice If”?

<Lesley>To do a good job.

<Bob>Yes. And that is what I asked you – but in an unfamiliar language. Translated into English I asked “What is a good job and how do you know you are doing one?”

<Lesley>Ah ha! That is it! That is the question I need to ask. And that links in the first map – The 4N Chart®. And it links in measurement, time-series charts and BaseLine© too. Wow!

<Bob>OK. So what is your second question?

<Lesley>Oh yes! I keep getting asked “How do we work out how much extra capacity we need?” and I answer “I doubt that you need any more capacity.”

<Bob>And their response is?

<Lesley>Anger and frustration! They say “That is obvious rubbish! We have a constant stream of complaints from patients about waiting too long and we are all maxed out so of course we need more capacity! We just need to know the minimum we can get away with – the what, where and when so we can work out how much it will cost for the business case.

<Bob>OK. So what do they mean by the word “capacity”. And what do you mean?

<Lesley>Capacity to do a good job?

<Bob>Very quick! Ho ho! That is a bit imprecise and subjective for a process designer though. The Laws of Physics need the terms “capacity”, “good” and “job” clearly defined – with units of measurement that are meaningful.

<Lesley>OK. Let us define “good” as “delivered on time” and “job” as “a patient with a health problem”.

<Bob>OK. So how do we define and measure capacity? What are the units of measurement?

<Lesley>Ah yes – I see what you mean. We touched on that in FISH but did not go into much depth.

<Bob>Now we dig deeper.

<Lesley>OK. FISH talks about three interdependent forms of capacity: flow-capacity, resource-capacity, and space-capacity.

<Bob>Yes. They are the space-and-time capacities. If we are too loose with our use of these and treat them as interchangeable then we will create the confusion and conflict that you have experienced. What are the units of measurement of each?

<Lesley>Um. Flow-capacity will be in the same units as flow, the same units as demand and activity – tasks per unit time.

<Bob>Yes. Good. And space-capacity?

<Lesley>That will be in the same units as work in progress or inventory – tasks.

<Bob>Good! And what about resource-capacity?

<Lesley>Um – Will that be resource-time – so time?

<Bob>Actually it is resource-time per unit time. So they have different units of measurement. It is invalid to mix them up any-old-way. It would be meaningless to add them for example.

<Lesley>OK. So I cannot see how to create a valid combination from these three! I cannot get the units of measurement to work.

<Bob>This is a critical insight. So what does that mean?

<Lesley>There is something missing?

<Bob>Yes. Excellent! Your homework this week is to work out what the missing pieces of the capacity-jigsaw are.

<Lesley>You are not going to tell me the answer?

<Bob>Nope. You are doing ISP training now. You already know enough to work it out.

<Lesley>OK. Now you have got me thinking. I like it. Until next week then.

<Bob>Have a good week.

Temperament Treacle

stick_figure_help_button_150_wht_9911If the headlines in the newspapers are a measure of social anxiety then healthcare in the UK is in a state of panic: “Hospitals Fear The Winter Crisis Is Here Early“.

The Panic Button is being pressed and the Patient Safety Alarms are sounding.

Closer examination of the statement suggests that the winter crisis is not unexpected – it is just here early.  So we are assuming it will be worse than last year – which was bad enough.

The evidence shows this fear is well founded.  Last year was the worst on the last 5 years and this year is shaping up to be worse still.

So if it is a predictable annual crisis and we have a lot of very intelligent, very committed, very passionate people working on the problem – then why is it getting worse rather than better?

One possible factor is Temperament Treacle.

This is the glacially slow pace of effective change in healthcare – often labelled as “resistance to change” and implying deliberate scuppering of the change boat by powerful forces within the healthcare system.

Resistance to the flow of change is probably a better term. We could call that cultural viscosity.  Treacle has a very high viscosity – it resists flow.  Wading through treacle is very hard work. So pushing change though cultural treacle is hard work. Many give up in exhaustion after a while.

So why the term “Temperament Treacle“?

Improvement Science has three parts – Processes, Politics and Systems.

Process Science is applied physics. It is an objective, logical, rational science. The Laws of Physics are not negotiable. They are absolute.

Political Science is applied psychology. It is a subjective, illogical, irrational science. The Laws of People are totally negotiable.  They are arbitrary.

Systems Science is a combination of Physics and Psychology. A synthesis. A synergy. A greater-than-the-sum-of-the-parts combination.

The Swiss physician Carl Gustav Jung studied psychology – and in 1920 published “Psychological Types“.  When this ground-breaking work was translated into English in 1923 it was picked up by Katherine Cook Briggs and made popular by her daughter Isabel.  Isabel Briggs married Clarence Myers and in 1942 Isabel Myers learned about the Humm-Wadsworth Scale,  a tool for matching people with jobs. So using her knowledge of psychological type differences she set out to develop her own “personality sorting tool”. The first prototype appeared in 1943; in the 1950’s she tested the third iteration and measured the personality types of 5,355 medical students and over 10,000 nurses.   The Myers-Briggs Type Indicator was published 1962 and since then the MBTI® has been widely tested and validated and is the most extensively used personality type instrument. In 1980 Isabel Myers finished writing Gifts Differing just before she died at the age of 82 after a twenty year long battle with cancer.

The essence of Jung’s model is that an individual’s temperament is largely innate and the result of a combination of three dimensions:

1. The input or perceiving  process (P). The poles are Intuitor (N) or Sensor (S).
2. The decision or judging process (J). The poles are Thinker (T) or Feeler (F).
3. The output or doing process. The poles are Extraversion (E) or Intraversion (I).

Each of Jung’s dimensions had two “opposite” poles so when combined they gave eight types.  Isabel Myers, as a result of her extensive empirical testing, added a fourth dimension – which gives the four we see in the modern MBTI®.  The fourth dimension linked the other three together – it describes if the J or the P process is the one shown to the outside world. So the MBTI® has sixteen broad personality types.  In 1998 a book called “Please Understand Me II” written by David Keirsey, the MBTI® is put into an historical context and Keirsey concluded that there are four broad Temperaments – and these have been described since Ancient times.

When Isabel Myers measured different populations using her new tool she discovered a consistent pattern: that the proportions of the sixteen MBTI® types were consistent across a wide range of societies. Personality type is, as Jung had suggested, an innate part of the “human condition”. She also saw that different types clustered in different occupations. Finding the “right job” appeared to be a process of natural selection: certain types fitted certain roles better than others and people self-selected at an early age.  If their choice was poor then the person would be unhappy and would not achieve their potential.

Isabel’s work also showed that each type had both strengths and weaknesses – and that people performed better and felt happier when their role played to their temperament strengths.  It also revealed that considerable conflict could be attributed to type-mismatch.  Polar opposite types have the least psychological “common ground” – so when they attempt to solve a common problem they do so by different routes and using different methods and language. This generates confusion and conflict.  This is why Isabel Myers gave her book the title of “Gifts Differing” and her message was that just having awareness of and respect for the innate type differences was a big step towards reducing the confusion and conflict.

So what relevance does this have to change and improvement?

Well it turns out that certain types are much more open to change than others and certain types are much more resistant.  If an organisation, by the very nature of its work, attracts the more change resistant types then that organisation will be culturally more viscous to the flow of change. It will exhibit the cultural characteristics of temperament treacle.

The key to understanding Temperament and the MBTI® is to ask a series of questions:

Q1. Does the person have the N or S preference on their perceiving function?

A1=N then Q2: Does the person have a T or F preference on their judging function?
A2=T gives the xNTx combination which is called the Rational or phlegmatic temperament.
A2=F gives the xNFx combination which is called the Idealist or choleric temperament.

A1=S then Q3: Does the person show a J or P preference to the outside world?
A3=J gives the xSxJ combination which is called the Guardian or melancholic temperament.
A3=P gives the xSxP combination which is called the Artisan or sanguine temperament.

So which is the most change resistant temperament?  The answer may not be a big surprise. It is the Guardians. The melancholics. The SJ’s.

Bureaucracies characteristically attract SJ types. The upside is that they ensure stability – the downside is that they prevent agility.  Bureaucracies block change.

The NF Idealists are the advocates and the mentors: they love initiating and facilitating transformations with the dream of making the world a better place for everyone. They light the emotional bonfire and upset the apple cart. The NT Rationals are the engineers and the architects. They love designing and building new concepts and things – so once the Idealists have cracked the bureaucratic carapace they can swing into action. The SP Sanguines are the improvisors and expeditors – they love getting the new “concept” designs to actually work in the messy real world.

Unfortunately the grand designs dreamed up by the ‘N’s often do not work in practice – and the scene is set for the we-told-you-so game, and the name-shame-blame game.

So if initiating and facilitating change is the Achilles Heel of the SJ’s then what is their strength?

Let us approach this from a different perspective:

Let us put ourselves in the shoes of patients and ask ourselves: “What do we want from a System of Healthcare and from those who deliver that care – the doctors?”

1. Safe?
2. Reliable?
3. Predictable?
4. Decisive?
5. Dependable?
6. All the above?

These are the strengths of the SJ temperament. So how do doctors measure up?

In a recent observational study, 168 doctors who attended a leadership training course completed their MBTI® self-assessments as part of developing insight into temperament from the perspective of a clinical leader.  From the collective data we can answer our question: “Are there more SJ types in the medical profession than we would expect from the general population?”

Doctor_Temperament The table shows the results – 60% of doctors were SJ compared with 35% expected for the general population.

Statistically this is highly significant difference (p<0.0001). Doctors are different.

It is of enormous practical importance well.

We are reassured that the majority of doctors have a preference for the very traits that patients want from them. That may explain why the Medical Profession always ranks highest in the league table of “trusted professionals”. We need to be able to trust them – it could literally be a matter of life or death.

The table also shows where the doctors were thin on the ground: in the mediating, improvising, developing, constructing temperaments. The very set of skills needed to initiate and facilitate effective and sustained change.

So when the healthcare system is lurching from one predictable crisis to another – the innate temperament of the very people we trust to deliver our health care are the least comfortable with changing the system of care itself.

That is a problem. A big problem.

Studies have show that when we get over-stressed, fearful and start to panic then in a desperate act of survival we tend to resort to the aspects of our temperament that are least well developed.  An SJ who is in panic-mode may resort to NP tactics: opinion-led purposeless conceptual discussion and collective decision paralysis. This is called the “headless chicken and rabbit in the headlights” mode. We have all experienced it.

A system that is no longer delivering fit-for-purpose performance because its purpose has shifted requires redesign.  The temperament treacle inhibits the flow of change so the crisis is not averted. The crisis happens, invokes panic and triggers ineffective and counter-productive behaviour. The crisis deepens and performance can drop catastrophically when the red tape is cut. It was the only thing holding the system together!

But while the bureaucracy is in disarray then innovation can start to flourish. And the next cycle starts.

It is a painful, slow, wasteful process called “reactionary evolution by natural selection“.

Improvement Science is different. It operates from a “proactive revolution through collective design” that is enjoyable, quick and efficient but it requires mastery of synergistic political science and process science. We do not have that capability – yet.

The table offers some hope.  It shows the majority of doctors are xSTJ.  They are Logical Guardians. That means that they solve problems using tried-tested-and-trustworthy logic. So they have no problem with the physics. Show them how to diagnose and design processes and they are inside their comfort zone.

Their collective weak spot is managing the politics – the critical cultural dimension of change. Often the result is manipulation rather than motivation. It does not work. The improvement stalls. Cynicism increases. The treacle gets thicker.

System-redesign requires synergistic support, development, improvisation and mediation. These strengths do exist in the medical profession – but they appear to be in short supply – so they need to be identified, and nurtured.  And change teams need to assemble and respect the different gifts.

One further point about temperament.  It is not immutable. We can all develop a broader set of MBTI® capabilities with guidance and practice – especially the ones that fill the gaps between xSTJ and xNFP.  Those whose comfort zone naturally falls nearer the middle of the four dimensions find this easier. And that is one of the goals of Improvement Science training.

Sorting_HatAnd if you are in a hurry then you might start today by identifying the xSFJ “supporters” and the xNFJ “mentors” in your organisation and linking them together to build a temporary bridge over the change culture chasm.

So to find your Temperament just click here to download the Temperament Sorter.

The Mirror

mirror_mirror[Dring Dring]

The phone announced the arrival of Leslie for the weekly ISP mentoring conversation with Bob.

<Leslie> Hi Bob.

<Bob> Hi Leslie. What would you like to talk about today?

<Leslie> A new challenge – one that I have not encountered before.

<Bob>Excellent. As ever you have pricked my curiosity. Tell me more.

<Leslie> OK. Up until very recently whenever I have demonstrated the results of our improvement work to individuals or groups the usual response has been “Yes, but“. The habitual discount as you call it. “Yes, but your service is simpler; Yes, but your budget is bigger; Yes, but your staff are less militant.” I have learned to expect it so I do not get angry any more.

<Bob> OK. The mantra of the skeptics is to be expected and you have learned to stay calm and maintain respect. So what is the new challenge?

<Leslie>There are two parts to it.  Firstly, because the habitual discounting is such an effective barrier to diffusion of learning;  our system has not changed; the performance is steadily deteriorating; the chaos is worsening and everything that is ‘obvious’ has been tried and has not worked. More red lights are flashing on the patient-harm dashboard and the Inspectors are on their way. There is an increasing  turnover of staff at all levels – including Executive.  There is an anguished call for “A return to compassion first” and “A search for new leaders” and “A cultural transformation“.

<Bob> OK. It sounds like the tipping point of awareness has been reached, enough people now appreciate that their platform is burning and radical change of strategy is required to avoid the ship sinking and them all drowning. What is the second part?

<Leslie> I am getting more emails along the line of “What would you do?

<Bob> And your reply?

<Leslie> I say that I do not know because I do not have a diagnosis of the cause of the problem. I do know a lot of possible causes but I do not know which plausible ones are the actual ones.

<Bob> That is a good answer.  What was the response?

<Leslie>The commonest one is “Yes, but you have shown us that Plan-Do-Study-Act is the way to improve – and we have tried that and it does not work for us. So we think that improvement science is just more snake oil!”

<Bob>Ah ha. And how do you feel about that?

<Leslie>I have learned the hard way to respect the opinion of skeptics. PDSA does work for me but not for them. And I do not understand why that is. I would like to conclude that they are not doing it right but that is just discounting them and I am wary of doing that.

<Bob>OK. You are wise to be wary. We have reached what I call the Mirror-on-the-Wall moment.  Let me ask what your understanding of the history of PDSA is?

<Leslie>It was called Plan-Do-Check-Act by Walter Shewhart in the 1930’s and was presented as a form of the scientific method that could be applied on the factory floor to improving the quality of manufactured products.  W Edwards Deming modified it to PDSA where the “Check” was changed to “Study”.  Since then it has been the key tool in the improvement toolbox.

<Bob>Good. That is an excellent summary.  What the Zealots do not talk about are the limitations of their wonder-tool.  Perhaps that is because they believe it has no limitations.  Your experience would seem to suggest otherwise though.

<Leslie>Spot on Bob. I have a nagging doubt that I am missing something here. And not just me.

<Bob>The reason PDSA works for you is because you are using it for the purpose it was designed for: incremental improvement of small bits of the big system; the steps; the points where the streams cross the stages.  You are using your FISH training to come up with change plans that will work because you understand the Physics of Flow better. You make wise improvement decisions.  In fact you are using PDSA in two separate modes: discovery mode and delivery mode.  In discovery mode we use the Study phase to build your competence – and we learn most when what happens is not what we expected.  In delivery mode we use the Study phase to build our confidence – and that grows most when what happens is what we predicted.

<Leslie>Yes, that makes sense. I see the two modes clearly now you have framed it that way – and I see that I am doing both at the same time, almost by second nature.

<Bob>Yes – so when you demonstrate it you describe PDSA generically – not as two complimentary but contrasting modes. And by demonstrating success you omit to show that there are some design challenges that cannot be solved with either mode.  That hidden gap attracts some of the “Yes, but” reactions.

<Leslie>Do you mean the challenges that others are trying to solve and failing?

<Bob>Yes. The commonest error is to discount the value of improvement science in general; so nothing is done and the inevitable crisis happens because the system design is increasingly unfit for the evolving needs.  The toast is not just burned it is on fire and is now too late to  use the discovery mode of PDSA because prompt and effective action is needed.  So the delivery mode of PDSA is applied to a emergent, ill-understood crisis. The Plan is created using invalid assumptions and guesswork so it is fundamentally flawed and the Do then just makes the chaos worse.  In the ensuing panic the Study and Act steps are skipped so all hope of learning is lost and and a vicious and damaging spiral of knee-jerk Plan-Do-Plan-Do follows. The chaos worsens, quality falls, safety falls, confidence falls, trust falls, expectation falls and depression and despair increase.

<Leslie>That is exactly what is happening and why I feel powerless to help. What do I do?

<Bob>The toughest bit is past. You have looked squarely in the mirror and can now see harsh reality rather than hasty rhetoric. Now you can look out of the window with different eyes.  And you are now looking for a real-world example of where complex problems are solved effectively and efficiently. Can you think of one?

<Leslie>Well medicine is one that jumps to mind.  Solving a complex, emergent clinical problems requires a clear diagnosis and prompt and effective action to stabilise the patient and then to cure the underlying cause: the disease.

<Bob>An excellent example. Can you describe what happens as a PDSA sequence?

<Leslie>That is a really interesting question.  I can say for starters that it does not start with P – we have learned are not to have a preconceived idea of what to do at the start because it badly distorts our clinical judgement.  The first thing we do is assess the patient to see how sick and unstable they are – we use the Vital Signs. So that means that we decide to Act first and our first action is to Study the patient.

<Bob>OK – what happens next?

<Leslie>Then we will do whatever is needed to stabilise the patient based on what we have observed – it is called resuscitation – and only then we can plan how we will establish the diagnosis; the root cause of the crisis.

<Bob> So what does that spell?

<Leslie> A-S-D-P.  It is the exact opposite of P-D-S-A … the mirror image!

<Bob>Yes. Now consider the treatment that addresses the root cause and that cures the patient. What happens then?

<Leslie>We use the diagnosis is used to create a treatment Plan for the specific patient; we then Do that, and we Study the effect of the treatment in that specific patient, using our various charts to compare what actually happens with what we predicted would happen. Then we decide what to do next: the final action.  We may stop because we have achieved our goal, or repeat the whole cycle to achieve further improvement. So that is our old friend P-D-S-A.

<Bob>Yes. And what links the two bits together … what is the bit in the middle?

<Leslie>Once we have a diagnosis we look up the appropriate treatment options that have been proven to work through research trials and experience; and we tailor the treatment to the specific patient. Oh I see! The missing link is design. We design a specific treatment plan using generic principles.

<Bob>Yup.  The design step is the jam in the improvement sandwich and it acts like a mirror: A-S-D-P is reflected back as P-D-S-A

<Leslie>So I need to teach this backwards: P-D-S-A and then Design and then A-S-P-D!

<Bob>Yup – and you know that by another name.

<Leslie> 6M Design®! That is what my Improvement Science Practitioner course is all about.

<Bob> Yup.

<Leslie> If you had told me that at the start it would not have made much sense – it would just have confused me.

<Bob>I know. That is the reason I did not. The Mirror needs to be discovered in order for the true value to appreciated. At the start we look in the mirror and perceive what we want to see. We have to learn to see what is actually there. Us. Now you can see clearly where P-D-S-A and Design fit together and the missing A-S-D-P component that is needed to assemble a 6M Design® engine. That is Improvement-by-Design in a nine-letter nutshell.

<Leslie> Wow! I can’t wait to share this.

<Bob> And what do you expect the response to be?

<Leslie>”Yes, but”?

<Bob> From the die hard skeptics – yes. It is the ones who do not say “Yes, but” that you want to engage with. The ones who are quiet. It is always the quiet ones that hold the key.

Three Essentials

There are three necessary parts before ANY improvement-by-design effort will gain traction. Omit any one of them and nothing happens.

stick_figure_drawing_three_check_marks_150_wht_5283

1. A clear purpose and an outline strategic plan.

2. Tactical measurement of performance-over-time.

3. A generic Improvement-by-Design framework.

These are necessary minimum requirements to be able to safely delegate the day-to-day and week-to-week tactical stuff the delivers the “what is needed”.

These are necessary minimum requirements to build a self-regulating, self-sustaining, self-healing, self-learning win-win-win system.

And this is not a new idea.  It was described by Joseph Juran in the 1960’s and that description was based on 20 years of hands-on experience of actually doing it in a wide range of manufacturing and service organisations.

That is 20 years before  the terms “Lean” or “Six Sigma” or “Theory of Constraints” were coined.  And the roots of Juran’s journey were 20 years before that – when he started work at the famous Hawthorne Works in Chicago – home of the Hawthorne Effect – and where he learned of the pioneering work of  Walter Shewhart.

And the roots of Shewhart’s innovations were 20 years before that – in the first decade of the 20th Century when innovators like Henry Ford and Henry Gantt were developing the methods of how to design and build highly productive processes.

Ford gave us the one-piece-flow high-quality at low-cost production paradigm. Toyota learned it from Ford.  Gantt gave us simple yet powerful visual charts that give us an understanding-at-a-glance of the progress of the work.  And Shewhart gave us the deceptively simple time-series chart that signals when we need to take more notice.

These nuggets of pragmatic golden knowledge have been buried for decades under a deluge of academic mud.  It is nigh time to clear away the detritus and get back to the bedrock of pragmatism. The “how-to-do-it” of improvement. Just reading Juran’s 1964 “Managerial Breakthrough” illustrates just how much we now take for granted. And how ignorant we have allowed ourselves to become.

Acquired Arrogance is a creeping, silent disease – we slip from second nature to blissful ignorance without noticing when we divorce painful reality and settle down with our own comfortable collective rhetoric.

The wake-up call is all the more painful as a consequence: because it is all the more shocking for each one of us; and because it affects more of us.

The pain is temporary – so long as we treat the cause and not just the symptom.

The first step is to acknowledge the gap – and to start filling it in. It is not technically difficult, time-consuming or expensive.  Whatever our starting point we need to put in place the three foundation stones above:

1. Common purpose.
2. Measurement-over-time.
3. Method for Improvement.

Then the rubber meets the road (rather than the sky) and things start to improve – for real. Lots of little things in lots of places at the same time – facilitated by the Junior Managers. The cumulative effect is dramatic. Chaos is tamed; calm is restored; capability builds; and confidence builds. The cynics have to look elsewhere for their sport and the skeptics are able to remain healthy.

Then the Middle Managers feel the new firmness under their feet – where before there were shifting sands. They are able to exert their influence again – to where it makes a difference. They stop chasing Scotch Mist and start reporting real and tangible improvement – with hard evidence. And they rightly claim a slice of the credit.

And the upwelling of win-win-win feedback frees the Senior Managers from getting sucked into reactive fire-fighting and the Victim Vortex; and that releases the emotional and temporal space to start learning and applying System-level Design.  That is what is needed to deliver a significant and sustained improvement.

And that creates the stable platform for the Executive Team to do Strategy from. Which is their job.

It all starts with the Three Essentials:

1. A Clear and Common Constancy of Purpose.
2. Measurement-over-time of the Vital Metrics.
3. A Generic Method for Improvement-by-Design.

The Black Curtain

Black_Curtain_and_DoorA couple of weeks ago an important event happened.  A Masterclass in Demand and Capacity for NHS service managers was run by an internationally renown and very experienced practitioner of Improvement Science.

The purpose was to assist the service managers to develop their capability for designing quality, flow and cost improvement using tried and tested operations management (OM) theory, techniques and tools.

It was assumed that as experienced NHS service managers that they already knew the basic principles of  OM and the foundation concepts, terminology, techniques and tools.

It was advertised as a Masterclass and designed accordingly.

On the day it was discovered that none of the twenty delegates had heard of two fundamental OM concepts: Little’s Law and Takt Time.

These relate to how processes are designed-to-flow. It was a Demand and Capacity Master Class; not a safety, quality or cost one.  The focus was flow.

And it became clear that none of the twenty delegates were aware before the day that there is a well-known and robust science to designing systems to flow.

So learning this fact came as a bit of a shock.

The implications of this observation are profound and worrying:

if a significant % of senior NHS operational managers are unaware of the foundations of operations management then the NHS may have problem it was not aware of …

because …

“if transformational change of the NHS into a stable system that is fit-for-purpose (now and into the future) requires the ability to design processes and systems that deliver both high effectiveness and high efficiency ...”

then …

it raises the question of whether the current generation of NHS managers are fit-for-this-future-purpose“.

No wonder that discovering a Science of  Improvement actually exists came as a bit of a shock!

And saying “Yes, but clinicians do not know this science either!” is a defensive reaction and not a constructive response. They may not but they do not call themselves “operational managers”.

[PS. If you are reading this and are employed by the NHS and do not know what Little’s Law and Takt Time are then it would be worth doing that first. Wikipedia is a good place to start].

And now we have another question:

“Given there are thousands of operational managers in the NHS; what does one sample of 20 managers tell us about the whole population?”

Now that is a good question.

It is also a question of statistics. More specifically quite advanced statistics.

And most people who work in the NHS have not studied statistics to that level. So now we have another do-not-know-how problem.

But it is still an important question that we need to understand the answer to – so we need to learn how and that means taking this learning path one step at a time using what we do know, rather than what we do not.

Step 1:

What do we know? We have one sample of 20 NHS service managers. We know something about our sample because our unintended experiment has measured it: that none of them had heard of Little’s Law or Takt Time. That is 0/20 or 0%.

This is called a “sample statistic“.

What we want to know is “What does this information tell us about the proportion of the whole population of all NHS managers who do have this foundation OM knowledge?”

This proportion of interest is called  the unknown “population parameter“.

And we need to estimate this population parameter from our sample statistic because it is impractical to measure a population parameter directly: That would require every NHS manager completing an independent and accurate assessment of their basic OM knowledge. Which seems unlikely to happen.

The good news is that we can get an estimate of a population parameter from measurements made from small samples of that population. That is one purpose of statistics.

Step 2:

But we need to check some assumptions before we attempt this statistical estimation trick.

Q1: How representative is our small sample of the whole population?

If we chose the delegates for the masterclass by putting the names of all NHS managers in a hat and drawing twenty names out at random, as in a  tombola or lottery, than we have what is called a “random sample” and we can trust our estimate of the wanted population parameter.  This is called “random sampling”.

That was not the case here. Our sample was self-selecting. We were not conducting a research study. This was the real world … so there is a chance of “bias”. Our sample may not be representative and we cannot say what the most likely bias is.

It is possible that the managers who selected themselves were the ones struggling most and therefore more likely than average to have a gap in their foundation OM knowledge. It is also possible that the managers who selected themselves are the most capable in their generation and are very well aware that there is something else that they need to know.

We may have a biased sample and we need to proceed with some caution.

Step 3:

So given the fact that none of our possibly biased sample of mangers were aware of the Foundation OM Knowledge then it is possible that no NHS service managers know this core knowledge.  In other words the actual population parameter is 0%. It is also possible that the managers in our sample were the only ones in the NHS who do not know this.  So, in theory, the sought-for population parameter could be anywhere between 0% and very nearly 100%.  Does that mean it is impossible to estimate the true value?

It is not impossible. In fact we can get an estimate that we can be very confident is accurate. Here is how it is done.

Statistical estimates of population parameters are always presented as ranges with a lower and an upper limit called a “confidence interval” because the sample is not the population. And even if we have an unbiased random sample we can never be 100% confident of our estimate.  The only way to be 100% confident is to measure the whole population. And that is not practical.

So, we know the theoretical limits from consideration of the extreme cases … but what happens when we are more real-world-reasonable and say – “let us assume our sample is actually a representative sample, albeit not a randomly selected one“.  How does that affect the range of our estimate of the elusive number – the proportion of NHS service managers who know basic operation management theory?

Step 4:

To answer that we need to consider two further questions:

Q2. What is the effect of the size of the sample?  What if only 5 managers had come and none of them knew; what if had been 50 or 500 and none of them knew?

Q3. What if we repeated the experiment more times? With the same or different sample sizes? What could we learn from that?

Our intuition tells us that the larger the sample size and the more often we do the experiment then the more confident we will be of the result. In other words  narrower the range of the confidence interval around our sample statistic.

Our intuition is correct because if our sample was 100% of the population we could be 100% confident.

So given we have not yet found an NHS service manager who has the OM Knowledge then we cannot exclude 0%. Our challenge narrows to finding a reasonable estimate of the upper limit of our confidence interval.

Step 5

Before we move on let us review where we have got to already and our purpose for starting this conversation: We want enough NHS service managers who are knowledgeable enough of design-for-flow methods to catalyse a transition to a fit-for-purpose and self-sustaining NHS.

One path to this purpose is to have a large enough pool of service managers who do understand this Science well enough to act as advocates and to spread both the know-of and the know-how.  This is called the “tipping point“.

There is strong evidence that when about 20% of a population knows about something that is useful for the whole population – then that knowledge  will start to spread through the grapevine. Deeper understanding will follow. Wiser decisions will emerge. More effective actions will be taken. The system will start to self-transform.

And in the Brave New World of social media this message may spread further and faster than in the past. This is good.

So if the NHS needs 20% of its operational managers aware of the Foundations of Operations Management then what value is our morsel of data from one sample of 20 managers who, by chance, were all unaware of the Knowledge.  How can we use that data to say how close to the magic 20% tipping point we are?

Step 6:

To do that we need to ask the question in a slightly different way.

Q4. What is the chance of an NHS manager NOT knowing?

We assume that they either know or do not know; so if 20% know then 80% do not.

This is just like saying: if the chance of rolling a “six” is 1-in-6 then the chance of rolling a “not-a-six” is 5-in-6.

Next we ask:

Q5. What is the likelihood that we, just by chance, selected a group of managers where none of them know – and there are 20 in the group?

This is rather like asking: what is the likelihood of rolling twenty “not-a-sixes” in a row?

Our intuition says “an unlikely thing to happen!”

And again our intuition is sort of correct. How unlikely though? Our intuition is a bit vague on that.

If the actual proportion of NHS managers who have the OM Knowledge is about the same chance of rolling a six (about 16%) then we sense that the likelihood of getting a random sample of 20 where not one knows is small. But how small? Exactly?

We sense that 20% is too a high an estimate of a reasonable upper limit.  But how much too high?

The answer to these questions is not intuitively obvious.

We need to work it out logically and rationally. And to work this out we need to ask:

Q6. As the % of Managers-who-Know is reduced from 20% towards 0% – what is the effect on the chance of randomly selecting 20 all of whom are not in the Know?  We need to be able to see a picture of that relationship in our minds.

The good news is that we can work that out with a bit of O-level maths. And all NHS service managers, nurses and doctors have done O-level maths. It is a mandatory requirement.

The chance of rolling a “not-a-six” is 5/6 on one throw – about 83%;
and the chance of rolling only “not-a-sixes” in two throws is 5/6 x 5/6 = 25/36 – about 69%
and the chance of rolling only “not-a-sixes” in three throws is 5/6 x 5/6 x 5/6 – about 58%… and so on.

[This is called the “chain rule” and it requires that the throws are independent of each other – i.e. a random, unbiased sample]

If we do this 20 times we find that the chance of rolling no sixes at all in 20 throws is about 2.6% – unlikely but far from impossible.

We need to introduce a bit of O-level algebra now.

Let us call the proportion of NHS service managers who understand basic OM, our unknown population parameter something like “p”.

So if p is the chance of a “six” then (1-p) is a chance of a “not-a-six”.

Then the chance of no sixes in one throw is (1-p)

and no sixes after 2 throws is (1-p)(1-p) = (1-p)^2 (where ^ means raise to the power)

and no sixes after three throws is (1-p)(1-p)(1-p) = (1-p)^3 and so on.

So the likelihood of  “no sixes in n throws” is (1-p)^n

Let us call this “t”

So the equation we need to solve to estimate the upper limit of our estimate of “p” is

t=(1-p)^20

Where “t” is a measure of how likely we are to choose 20 managers all of whom do not know – just by chance.  And we want that to be a small number. We want to feel confident that our estimate is reasonable and not just a quirk of chance.

So what threshold do we set for “t” that we feel is “reasonable”? 1 in a million? 1 in 1000? 1 in 100? 1 in10?

By convention we use 1 in 20 (t=0.05) – but that is arbitrary. If we are more risk-averse we might choose 1:100 or 1:1000. It depends on the context.

Let us be reasonable – let is say we want to be 95% confident our our estimated upper limit for “p” – which means we are calculating the 95% confidence interval. This means that will accept a 1:20 risk of our calculated confidence interval for “p” being wrong:  a 19:1 odds that the true value of “p” falls outside our calculated range. Pretty good odds! We will be reasonable and we will set the likelihood threshold for being “wrong” at 5%.

So now we need to solve:

0.05= (1-p)^20

And we want a picture of this relationship in our minds so let us draw a graph of t for a range of values of p.

We know the value of p must be between 0 and 1.0 so we have all we need and we can generate this graph easily using Excel.  And every senior NHS operational manager knows how to use Excel. It is a requirement. Isn’t it?

Black_Curtain

The Excel-generated chart shows the relationship between p (horizontal axis) and t (vertical axis) using our equation:

t=(1-p)^20.

Step 7

Let us first do a “sanity check” on what we have drawn. Let us “check the extreme values”.

If 0% of managers know then a sample of 20 will always reveal none – i.e. the leftmost point of the chart. Check!

If 100% of managers know then a sample of 20 will never reveal none – i.e. way off to the right. Check!

What is clear from the chart is that the relationship between p and t  is not a straight line; it is non-linear. That explains why we find it difficult to estimate intuitively. Our brains are not very good at doing non-linear analysis. Not very good at all.

So we need a tool to help us. Our Excel graph.  We read down the vertical “t” axis from 100% to the 5% point, then trace across to the right until we hit the line we have drawn, then read down to the corresponding value for “p”. It says about 14%.

So that is the upper limit of our 95% confidence interval of the estimate of the true proportion of NHS service managers who know the Foundations of Operations Management.  The lower limit is 0%.

And we cannot say better than somewhere between  0%-14% with the data we have and the assumptions we have made.

To get a more precise estimate,  a narrower 95% confidence interval, we need to gather some more data.

[Another way we can use our chart is to ask “If the actual % of Managers who know is x% the what is the chance that no one of our sample of 20 will know?” Solving this manually means marking the x% point on the horizontal axis then tracing a line vertically up until it crosses the drawn line then tracing a horizontal line to the left until it crosses the vertical axis and reading off the likelihood.]

So if in reality 5% of all managers do Know then the chance of no one knowing in an unbiased sample of 20 is about 35% – really quite likely.

Now we are getting a feel for the likely reality. Much more useful than just dry numbers!

But we are 95% sure that 86% of NHS managers do NOT know the basic language  of flow-improvement-science.

And what this chart also tells us is that we can be VERY confident that the true value of p is less than 2o% – the proportion we believe we need to get to transformation tipping point.

Now we need to repeat the experiment experiment and draw a new graph to get a more accurate estimate of just how much less – but stepping back from the statistical nuances – the message is already clear that we do have a Black Curtain problem.

A Black Curtain of Ignorance problem.

Many will now proclaim angrily “This cannot be true! It is just statistical smoke and mirrors. Surely our managers do know this by a different name – how could they not! It is unthinkable to suggest the majority of NHS manages are ignorant of the basic science of what they are employed to do!

If that were the case though then we would already have an NHS that is fit-for-purpose. That is not what reality is telling us.

And it quickly become apparent at the master class that our sample of 20 did not know-this-by-a-different-name.

The good news is that this knowledge gap could hiding the opportunity we are all looking for – a door to a path that leads to a radical yet achievable transformation of the NHS into a system that is fit-for-purpose. Now and into the future.

A system that delivers safe, high quality care for those who need it, in full, when they need it and at a cost the country can afford. Now and for the foreseeable future.

And the really good news is that this IS knowledge gap may be  and extensive deep but it is not wide … the Foundations are is easy to learn, and to start applying immediately.  The basics can be learned in less than a week – the more advanced skills take a bit longer.  And this is not untested academic theory – it is proven pragmatic real-world problem solving know-how. It has been known for over 50 years outside healthcare.

Our goal is not acquisition of theoretical knowledge – is is a deep enough understanding to make wise enough  decisions to achieve good enough outcomes. For everyone. Starting tomorrow.

And that is the design purpose of FISH. To provide those who want to learn a quick and easy way to do so.

Stop Press: Further feedback from the masterclass is that some of the managers are grasping the nettle, drawing back their own black curtains, opening the door that was always there behind it, and taking a peek through into a magical garden of opportunity. One that was always there but was hidden from view.

A Treaty with the Lions

This week I heard an inspiring story of applied Improvement Science that has delivered a win-win-win result. Not in a hospital. Not in a factory. In the red-in-tooth-and-claw reality of rural Kenya.

Africa has vast herds of four-hoofed herbivors called zebra and wildebeast who are accompanied by clever and powerful carnivors – called lions. The sun and rain make the grass grow; the herbivors eat the grass and the carnivors eat the herbivors. It is the way of Nature – and has been so for millions of years.

Enter Man a few thousand years ago with his domesticated cattle and the scene is set for conflict.  Domestic cattle are easy pickings for a hungry lion. Why spend a lot of energy chasing a lively zebra or wildebeast and run the risk of injury that would spell death-by-starvation? Lions are strong and smart but they do not have a social security system to look after the injured and sick. So why not go for the easier option?

Maasai_WarriorsSo Man protects his valuable cattle from hungry lions. And Man is inventive.  The cattle need to eat and sleep like the rest of us – so during the day the cattle are guarded by brave Maasai warriors armed with spears; and at night the cattle are herded into acacia thorn-ringed kraals and watched over by the boys of the tribe.

The lions come at night. Their sense of smell and sight is much better developed than Man’s.

The boys job is to deter the lions from killing the cattle.

And this conflict has been going on for thousands of years.

So when a hungry lion kills a poorly guarded cow or bull – then Man will get revenge and kill the lion.  Everyone loses.

But the application of Improvement Science is changing that ancient conflict.  And it was not done by a scientist or an animal welfare evangelist or a trained Improvementologist. It was done by young Maasai boy called Richard Turere.

He describes the why, the what and the how  … HERE.

Richard_TurereSo what was his breakthrough?

It was noticing that walking about with a torch  was a more effective lion deterrent than a fire or a scarecrow.

That was the chance discovery.  Chance favours the prepared mind.

So how do we create a prepared mind that is receptive to the hints that chance throws at us?

That is one purpose of learning Improvement Science.

What came after the discovery was not luck … it was design.

Richard used what was to hand to design a solution that achieved the required purpose – an effective lion deterrent – in a way that was also an efficient use of his lifetime.

He had bigger dreams than just protecting his tribe’s cattle. His dream was to fly in one of those silver things that he saw passing high over the savannah every day.

And sitting up every night waving a torch to deter hungry lions from eating his father’s cattle was not going to deliver that dream.

So he had to nail that Niggle before he could achieve his Nice If.

Like many budding inventors and engineers Richard is curious about how things work – and he learned a lot about electronics by dismantling his mother’s radio! It got him into a lot of trouble – but the knowledge and understanding that he gained was put to good use when he designed his “lion lights”.

This true story captures the essence of Improvement Science better than any blog, talk, lecture, course or book could.

That is why it was shared by those who learned of his improvement; then to TED; then to the World; then passed to me and I am passing it on too.  It is an inspiring story. It says that anyone can do this sort of thing if they choose to.

And it shows how Improvement Science spreads.  Through the grapevine.  And understanding how that works is part of the Science.

The Victim Vortex

[Beep Beep] Bob tapped the “Answer” button on his smartphone – it was Lesley calling in for their regular ISP coaching session.

<Bob>Hi Lesley. How are you today? And which tunnel in the ISP Learning Labyrinth shall we explore today?

<Lesley>Hi Bob. I am OK thank you. Can we invest some time in the Engagement Maze?

<Bob>OK. Do you have a specific example?

<Lesley>Sort of. This week I had a conversation with our Chief Executive about the potential of Improvement Science and the reply I got was “I am convinced by what you say but it is your colleagues who need to engage. If you have not succeeded in convincing them then how can I?” I was surprised by that response and slightly niggled because it had an uncomfortable nugget of truth in it.

<Bob>That sounds like the wisdom of a leader who understands that the “power” to make things happen does not sit wholly in the lap of those charged with accountability.

<Lesley> I agree.  And at the same time everything that the “Top Team” suggest gets shot down in flames by a small and very vocal group of my more skeptical colleagues.

<Bob>Ah ha!  It sounds like the Victim Vortex is causing trouble here.

<Lesley>The Victim Vortex?

<Bob>Yes.  Let me give you an example.  One of the common initiators of the Victim Vortex is the data flow part of a complex system design.  The Sixth Flow.  So can I ask you: “How are new information systems developed in your organization?

<Lesley>Wow!  You hit the nail on the head first time!  Just this week there has been another firestorm of angry emails triggered by yet another silver-bullet IT system being foisted on us!

<Bob>Interesting use of language Lesley.  You sound quite “niggled”.

<Lesley>I am.  Not by the constant “drizzle of IT magic” – that is irritating enough – but more by the vehemently cynical reaction of my peers.

<Bob>OK.  This sounds like good enough example of the Victim Vortex.  What do you expect the outcome will be?

<Lesley>Well, if past experience is a predictor for future performance – an expensive failure, more frustration and a deeper well of cynicism.

<Bob>Frustrating for whom?

<Lesley>Everyone.  The IT department as well.  It feels like we are all being sucked into a lose-lose-lose black hole of depression and despair!

<Bob>A very good description of the Victim Vortex.

<Lesley>So the Victim Vortex is an example of the Drama Triangle acting on an organizational level?

tornada_150_wht_10155<Bob>Yes. Visualize a cultural tornado.  The energy that drives it is the emotional  currency spent in playing the OK – Not OK Games.  It is a self-fueling system, a stable design, very destructive and very resistant to change.

<Lesley>That metaphor works really well for me!

<Bob>A similar one is a whirlpool – a water vortex.  If you were out swimming and were caught up in a whirlpool what are your exit strategy options?

<Lesley>An interesting question.  I have never had that experience and would not want it – it sounds rather hazardous.  Let me think.  If I do nothing I will just get swept around in the chaos and I am at risk of  getting bashed, bruised and then sucked under.

<Bob>Yes – you would probably spend all your time and energy just treading water and dodging the flotsam and jetsam that has been sucked into the Vortex.  That is what most people do.  It is called the Hamster Wheel effect.

<Lesley>So another option is to actively swim towards the middle of the Vortex – the end would at least be quick! But that is giving up and adopting the Hopelessness attitude of burned out Victim.  That would be the equivalent of taking voluntary redundancy or early retirement.  It is not my style!

<Bob>Yes.  It does not solve the problem either.  The Vortex is always hoovering up new Victims.  It is insatiable.

<Lesley> And another option would be to swim with the flow to avoid being “got” from behind.  That would be seem sensible and is possible; and at least I would feel better for doing something. I might even escape if I swim fast enough!

<Bob>That is indeed what some try.  The movers and shakers.  The pace setters.  The optimists.  The extrovert leaders.  The problem is that it makes the Vortex spin even faster.  It actually makes the Vortex bigger,  more chaotic and more dangerous than before.

<Lesley>Yes – I can see that.  So my other option is to swim against the flow in an attempt to slow the Vortex down.  Would that work?

<Bob>If everyone did that at the same time it might but that is unlikely to happen spontaneously.  If you could achieve that degree of action alignment you would not have a Victim Vortex in the first place.  Trying to do it alone is ineffective, you tire very quickly, the other Victims bash into you, you slow them down, and then you all get sucked down the Plughole of Despair.

<Lesley>And I suppose a small group of like-minded champions who try to swim-against the flow might last longer if they stick together but even then eventually they would get bashed up and broken up too.  I have seen that happen.  And that is probably where our team are heading at the moment.  I am out of options.  Is it impossible to escape the Victim Vortex?

<Bob>There is one more direction you can swim.

<Lesley>Um?  You mean across the flow heading directly away from the center?

<Bob>Exactly.  Consider that option.

<Lesley>Well, it would still be hard work and I would still be going around with the Vortex and I would still need to watch out for flotsam but every stroke I make would take me further from the center.  The chaos would get gradually less and eventually I would be in clear water and out of danger.  I could escape the Victim Vortex!

<Bob>Yes. And what would happen if others saw you do that and did the same?

<Lesley>The Victim Vortex would dissipate!

<Bob>Yes.  So that is your best strategy.  It is a win-win-win strategy too. You can lead others out of the Victim Vortex.

<Lesley>Wow!  That is so cool!  So how would I apply that metaphor to the Information System niggle?

<Bob>I will leave you to ponder on that.  Think about it as a design assignment.  The design of the system that generates IT solutions that are fit-for-purpose.

<Lesley> Somehow I knew you were going to say that!  I have my squared-paper and sharpened pencil at the ready.  Yes – an improvement-by-design assignment.  Thank you once again Bob.  This ISP course is the business!